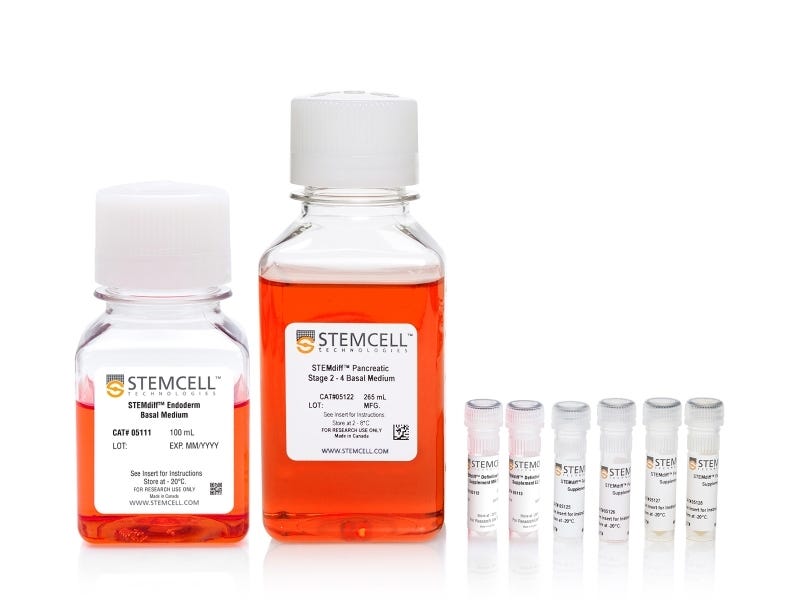
STEMdiff™ Pancreatic Progenitor Kit
Serum-free medium for the differentiation of human ES and iPS cells to pancreatic progenitor cells
Request Pricing
Thank you for your interest in this product. Please provide us with your contact information and your local representative will contact you with a customized quote. Where appropriate, they can also assist you with a(n):
Estimated delivery time for your area
Product sample or exclusive offer
In-lab demonstration
-
 Gentle Cell Dissociation Reagent
cGMP, enzyme-free cell dissociation reagent
-
 D-PBS (Without Ca++ and Mg++)
Dulbecco’s phosphate-buffered saline without calcium and magnesium
-
 Y-27632 (Dihydrochloride)
RHO/ROCK pathway inhibitor; Inhibits ROCK1 and ROCK2
Overview
Data Figures
Protocols and Documentation
Find supporting information and directions for use in the Product Information Sheet or explore additional protocols below.
Applications
This product is designed for use in the following research area(s) as part of the highlighted workflow stage(s). Explore these workflows to learn more about the other products we offer to support each research area.
Resources and Publications
Educational Materials (12)


Testimonials
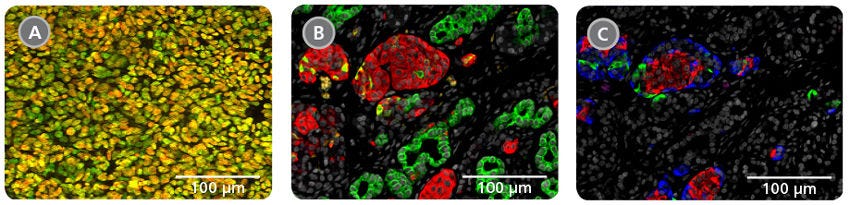
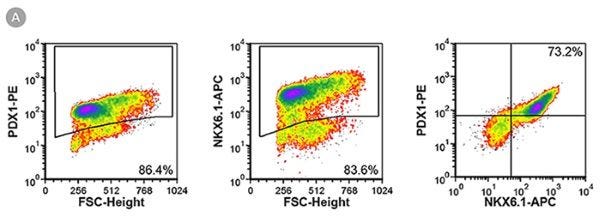
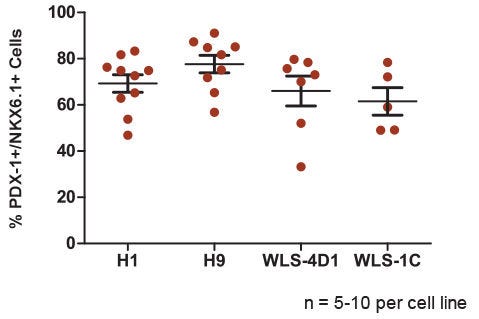
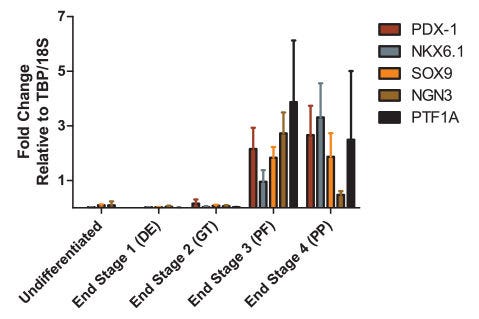
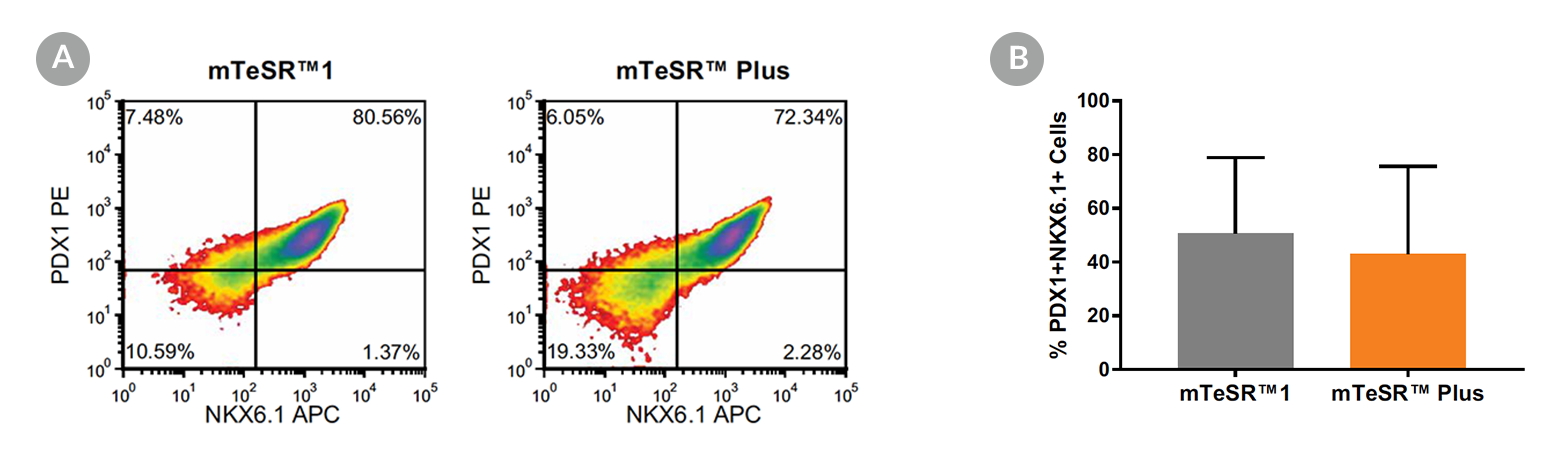
We get a really great efficiency of differentiation in several pluripotent stem cell lines determined by expression of key markers: upregulation of PDX1, SOX9, FOXA2 and GATA4, and down-regulation of Sox17. We can generate these pancreatic progenitor cells reproducibly and efficiently; variability within the protocol is low.
Drs. Jamie Trott and Ray Dunn, A*STAR Institute of Medical Biology (IMB), Singapore
Related Products


PRODUCTS ARE FOR RESEARCH USE ONLY AND NOT INTENDED FOR HUMAN OR ANIMAL DIAGNOSTIC OR THERAPEUTIC USES UNLESS OTHERWISE STATED.
