
Immunological Assessment
With Contract Assay Services
Evaluate the immunomodulatory effects of your preclinical test compounds and biologics on the immune system by partnering with our Contract Assay Services (CAS) team. Using standardized and customized cell-based assays performed by our in-house experts, you can obtain timely and clinically relevant data that can help you speed up the translation of your drug candidates into the clinic. Whether you’re working with fresh or frozen cell samples derived from human or mouse sources, our studies are designed and optimized to meet client-specific needs.
Contact us to learn more about how we can help answer your immunological questions or explore our immunological tools and assay systems below.
Evaluation of Intracellular and Surface Marker Expression of Immune Cells
Our in-house immunology experts can help you assess the effect of your test compounds and biologics on immune marker expression. Using multicolor flow cytometry analysis, our scientists can evaluate both surface and intracellular marker expression of different subsets of immune cells in a heterogeneous cell population.
Testing can be performed on fresh or frozen samples, including:
- Normal/diseased human whole blood
- Enriched leukapheresis products
- Cord blood
- Bone marrow
Contact us to learn more about how we can develop custom immunological assays to meet your specific needs. In the meantime, explore our data from previous studies:
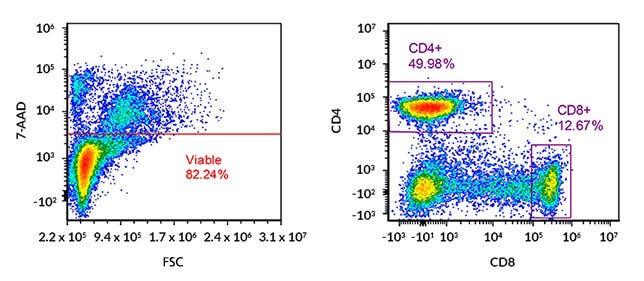
Figure 1. Flow Cytometry Analysis of Cultured Human Peripheral Blood Mononuclear Cells (PBMCs) with Gating on Viable CD4+ and CD8+ T Cells
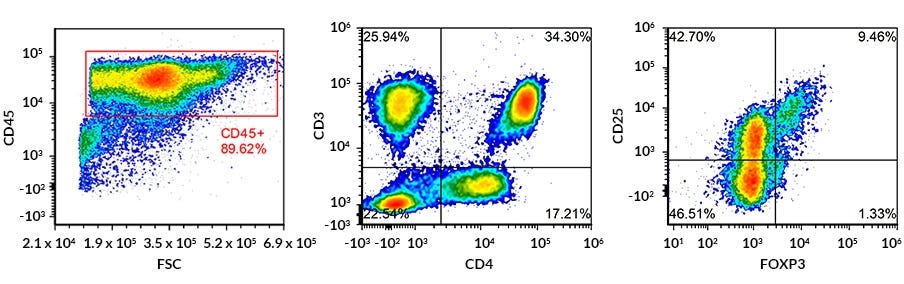
Figure 2. Flow Cytometry Analysis of Fresh Human Regulatory T Cells in Total PBMC Sample with Gating on the CD45+ CD3+ CD4+ CD25+ and FOXP3+ Population
Evaluation of Immune Cell Activation, Proliferation, and Viability
CAS can help you assess the immunomodulatory effects of your test compounds on PBMCs or specific cell subsets such as T cells (isolated from normal or diseased samples) in culture by monitoring cell proliferation, marker expression, and viability by flow cytometry.
Contact us to learn more about how we can develop custom immunological assays to meet your specific needs. See data from a previous study below:
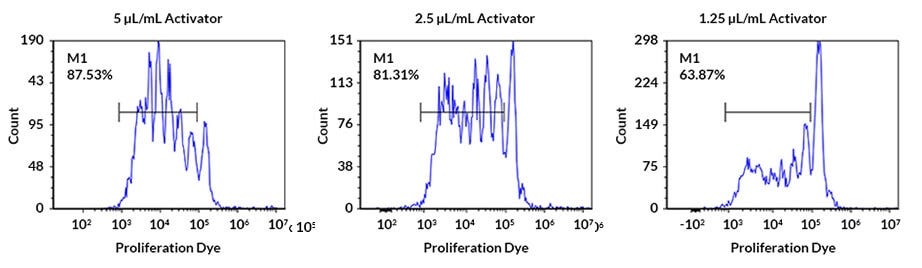
Figure 3. Human PBMC Proliferation After Activation
Human peripheral blood mononuclear cells (PBMCs) were stimulated with different concentrations of ImmunoCult™ Human CD3/CD28 T Cell Activator (Catalog # 10971) for 5 days. PBMCs were labelled with cell tracking dye, and viability was measured by gating on 7-AAD (viability dye) negative cells. Proliferation was measured by flow cytometric analysis. Each peak represents a cell division.
Quantitation of Cytokines and Growth Factors
CAS can help you quantify the immunomodulatory functions of your test compounds in activated immune cells with the following assays:
- Intracellular flow cytometry analysis
- Enzyme linked immunosorbent assay (ELISA)
- Meso Scale Discovery Multiplex Array: Contract Assay Services is a certified CRO partner of Meso Scale Discovery
Contact us to learn more about how we can use these technologies and develop custom assays to meet your specific needs.

Figure 4. Intracellular Flow Cytometric Analysis of Immune Cytokines
Activated human T cells (gated on CD4+ and CD8+ populations) were analyzed by intracellular flow cytometry for IFN-γ and TNF-α expression. After the cells were fixed and permeabilized, antibodies against the cytokine of interest were added to the cell suspension, followed by flow cytometry.
©2013 Meso Scale Discovery a division of Meso Scale Diagnostics, LLC. All rights reserved.
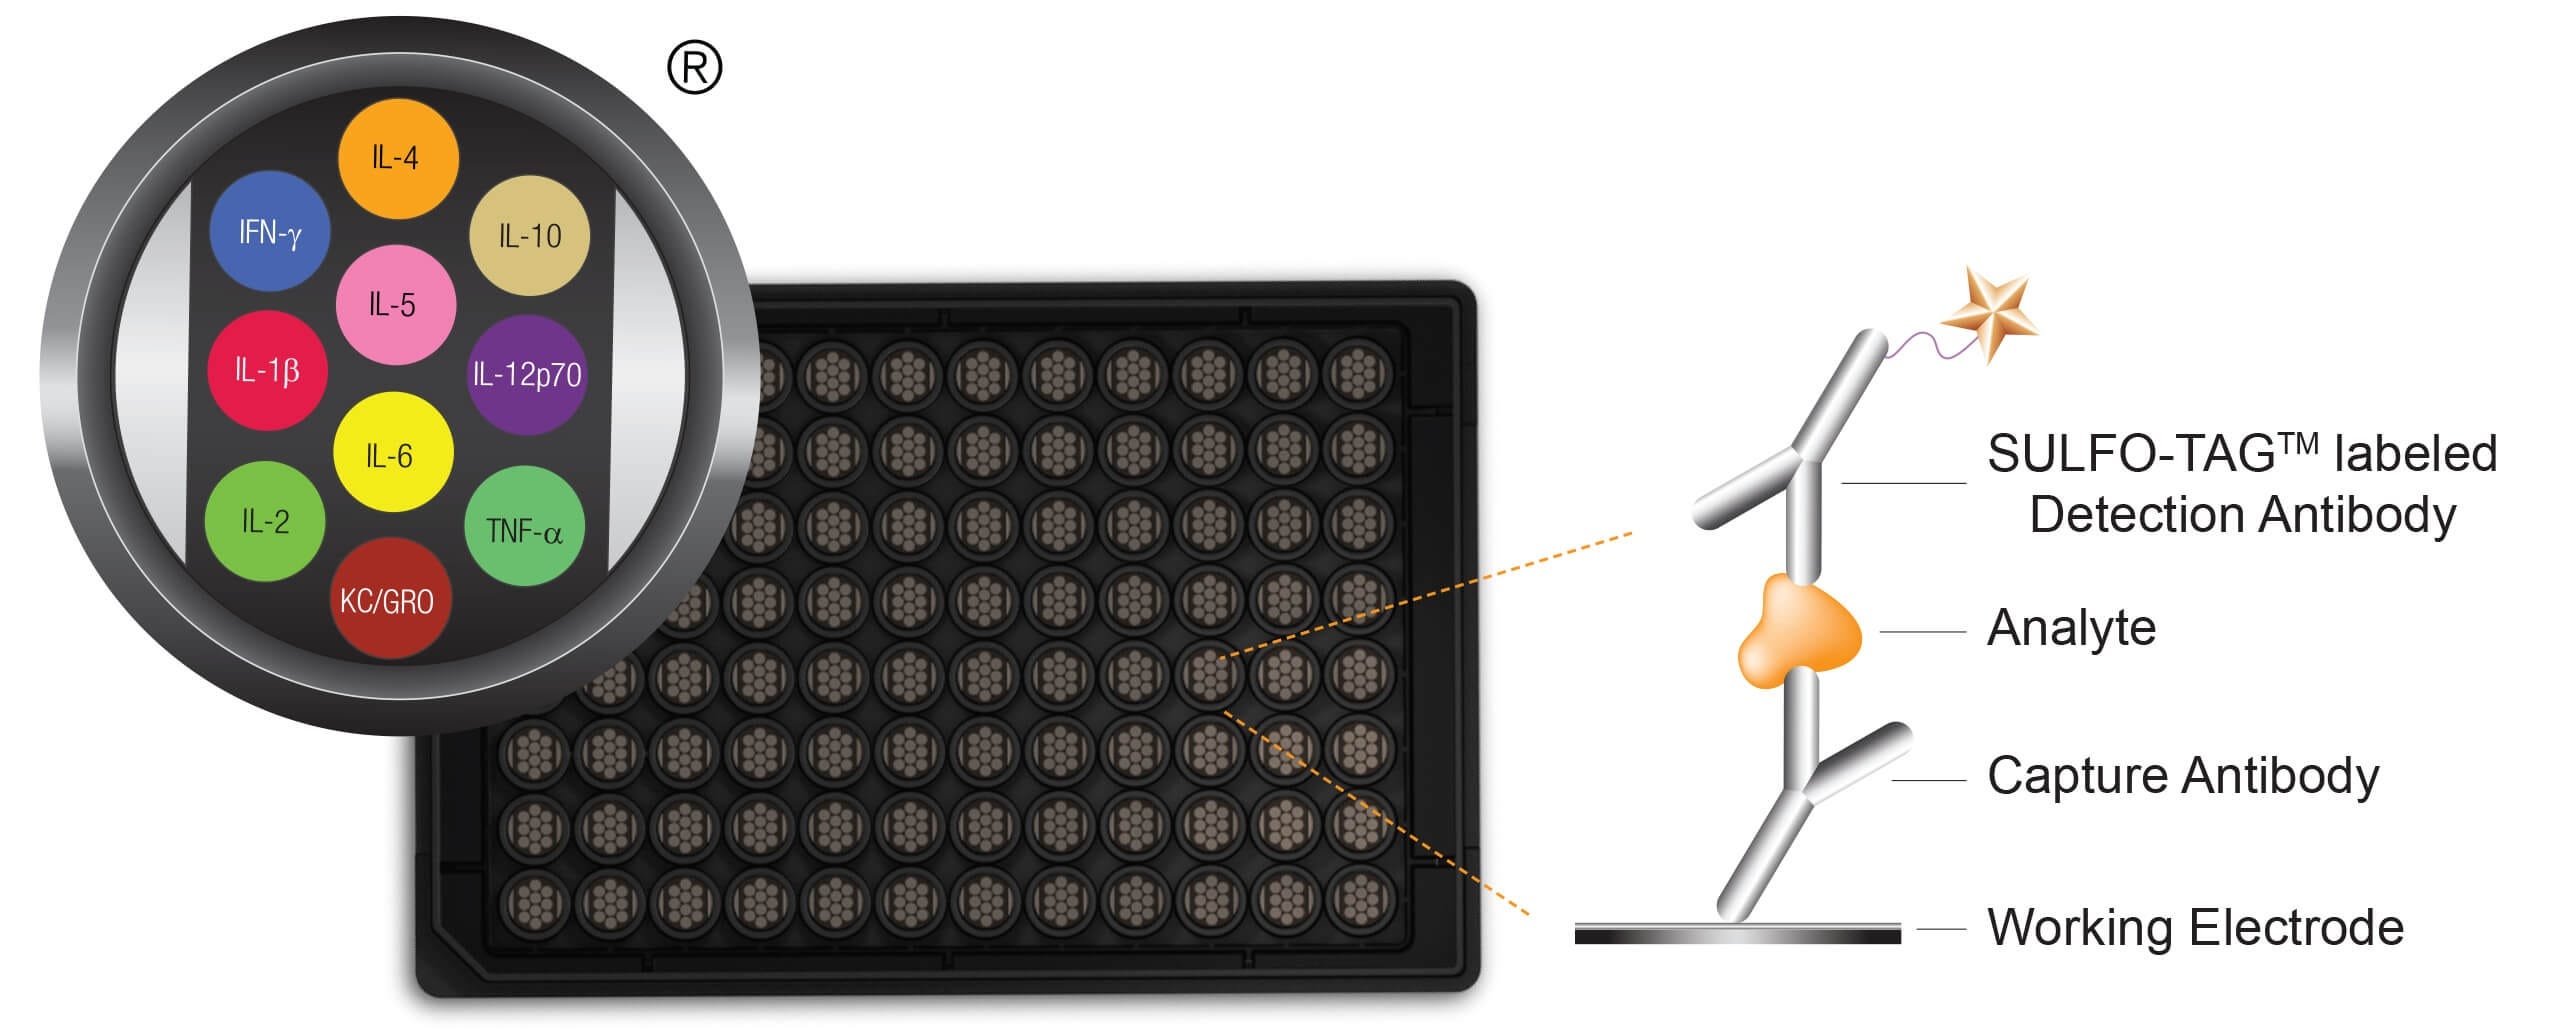
Figure 5. Schematic Representation of Meso Scale Discovery Multiplex Platform
Macrophage Differentiation and Activation Assessment
Macrophages play an important role in defense against pathogens and in tissue homeostasis. The presence of various stimuli in the tissue environment creates different states of macrophage activation or polarization influencing macrophage phenotype and function. Evaluate the effect of your test compounds and biologics on macrophage differentiation and activation with assays designed and performed by our in-house experts, such as:
- Flow cytometry for immunophenotyping
- Meso Scale Discovery Multiplex system for cytokine expression
- qPCR for gene expression
Our services use serum- and animal component-free ImmunoCult™ culture media that is specifically designed for the activation, expansion, and differentiation of immune cell subsets such as macrophages. To fit your specific needs, we also offer standardized and customized formulations for your studies.
Use our macrophage assay to study the effect of compounds or biologics on:
- M0 macrophage differentiation
- M1 and M2 macrophage activation, polarization, and cytokine secretion
Contact us to learn more about this assay service or explore our macrophage assay protocol and data from previous studies below.

Figure 6. Protocol for the Generation and Treatment of M1 or M2a Macrophages
Monocyte-derived macrophages (MDM) are derived from isolated monocytes by culturing the cells in ImmunoCult™ SF Macrophage Differentiation Medium (ImmunoCult™ SF Macrophage Medium, Catalog #10961 with added Human Recombinant MCSF, Catalog #78057). In this 8-day protocol, cultures are topped-up with fresh ImmunoCult™-SF Macrophage Differentiation Medium on Day 4 and specific macrophage activation is initiated using appropriate stimuli on Day 6 (IFN-γ+LPS for M1 activation and IL-4 for M2a activation). Cultures are treated with test compounds at the time of activation (Day 6). On Day 8, fully mature M1 or M2a macrophages can be harvested for evaluation of drug treatment effects.

Figure 7. Surface Marker and Cytokine Expression of Activated Macrophages Generated with ImmunoCult™-SF Macrophage Medium
Monocytes were cultured in ImmunoCult™-SF Macrophage Medium and differentiated into macrophages as shown in Figure 6. On Day 8, macrophages were harvested, counted, and analyzed by flow cytometry to assess the expression of macrophage markers CD80, CCR7, CD206, and CD209. M1 macrophages (A) were CD80+CCR7+, whereas M2a macrophages (B) showed a CD206+CD209+ phenotype. On Day 8, supernatants from M1 and M2a macrophage cultures were collected and the concentrations of TNF-α, IL-12 (p70), and IL-1RA determined by Meso Scale Discovery immunoassay. M1 macrophages (C) secreted high levels of TNF-α and low levels of IL-12 (p70) while M2a macrophages (D) secreted low levels of TNF-α and high levels of IL-1RA, as expected. Data represents the mean ± SD of triplicate wells from a representative donor.

Figure 8. Decrease in Expression of M1 Surface Markers and Secretion of M1 Cytokines After Treatment with a Known M1 Inhibitor
Monocytes were cultured in ImmunoCult™-SF Macrophage Medium and differentiated into macrophages as shown in Figure 6. On Day 6, macrophages were treated with a known M1 inhibitor at the time of activation, as shown in Figure 1. At Day 8, supernatants were harvested for evaluation of cytokine secretion by Meso Scale Discovery immunoassay and macrophages were harvested, counted, and analyzed by flow cytometry for expression of macrophage markers CD80, CCR7, CD206, and CD209. Treatment with an M1 inhibitory compound resulted in a decrease in the median fluorescence intensity (MFI) of M1 markers CD80 and CCR7, while M2a markers CD206 and CD209 were unaffected (A). Similarly, treatment with a known M1 inhibitor decreased secretion of TNF-α and IL-12 (p70), as expected (B). Data represents the mean ± SD of triplicate wells from a representative donor.

Figure 9. Decrease in Expression of M2a Surface Markers and Secretion of M2a Cytokine After Treatment with a Known M2 Inhibitor
Monocytes were cultured in ImmunoCult™-SF Macrophage Medium and differentiated into macrophages as shown in Figure 6. On Day 6, macrophages were treated with a known M2 inhibitor at the time of activation, as shown in Figure 6. On Day 8, supernatants were harvested for evaluation of cytokine secretion by Meso Scale Discovery immunoassay and macrophages were harvested, counted, and analyzed by flow cytometry for expression of macrophage markers CD80, CCR7, CD206, and CD209. Treatment with an M2 inhibitory compound resulted in a decrease in the MFI of M2a markers CD206 and CD209, while M1 markers CD80 and CCR7 were unaffected (A). Similarly, treatment with a known M2 inhibitor decreased secretion of IL-1RA, as expected (B). Data represents the mean ± SD of triplicate wells from a representative donor.
T Cell Suppression Assay
Regulatory T (Treg) cells suppress exuberant immune activation and promote immunological tolerance. Use CAS’s T Cell suppression assay to evaluate the immunomodulatory effect of pre-clinical test compounds and biologics on Treg cell function.
CAS’s T cell suppression assay uses serum- and animal component-free ImmunoCult™ culture media that is specifically designed for:
- Robust T cell activation and expansion without the use of magnetic beads, feeder cells, or antigens.
- Consistent T cell expansion
- Differentiation of Th1, Th2, or Treg cells
Contact us directly to see how we can support your research goals. In the meantime, read more about assessing T cell activation and suppression in drug development.
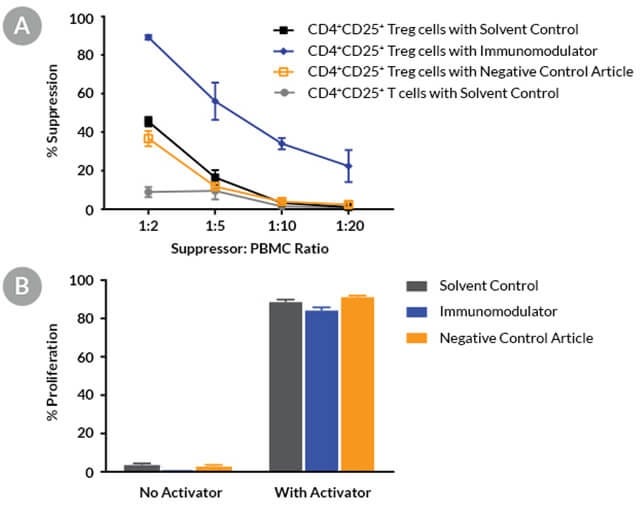
Figure 10. Compounds Can Be Screened for Immunomodulatory Effects Using the Treg Cell Suppression Assay
Fresh Treg cells and PBMCs were purified from a healthy donor. Treg cells and PBMCs were co-cultured in the presence of a solvent, an immunomodulatory compound, or a negative control article and then activated for 4 days with ImmunoCult™ Human CD3/CD28 T Cell Activator in ImmunoCult™-XF T Cell Expansion Medium. (A) The suppression response at the 1:2 Treg:PBMC ratio was 45% for the solvent control, 37% for the negative control article and 89% for the immunomodulator. Co-culturing with conventional CD4+CD25- T cells showed < 10% of the suppression response (mean ± SD, n = 3, single donor). (B) Control experiments demonstrating the proliferation of responder cells in the absence of Treg cells are shown. Cells were cultured in conditions as described above. The immunomodulator alone had a minimal effect on responder cell proliferation (mean ± SD, n = 3, a representative single donor).
Book a Consultation
Start the conversation on how these immunological assay services can be used to answer your specific questions.

