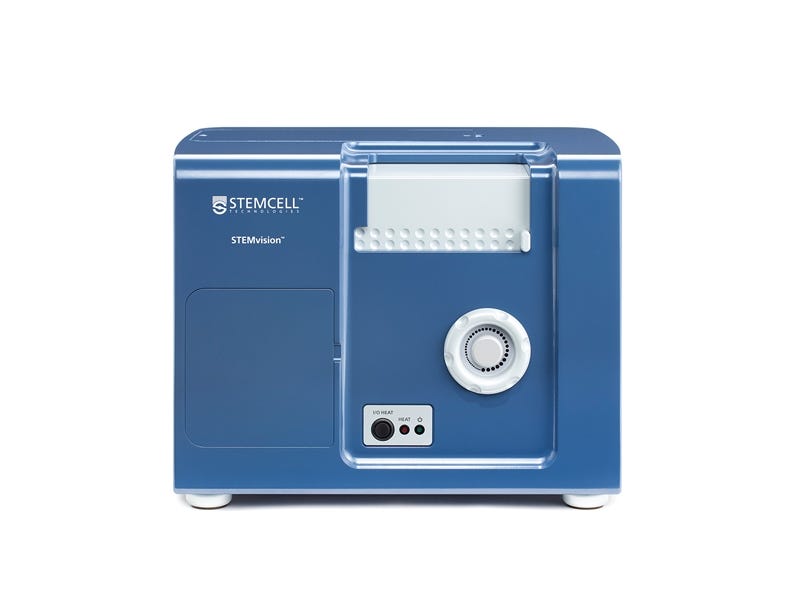
STEMvision™

Automated and standardized colony counting for the hematopoietic colony-forming unit (CFU) assay

Now Available: STEMvision™ 21 CFR Part 11 Compliance Software Add-On (Catalog #500-0110). Request pricing above for more information.

STEMvision™

Automated and standardized colony counting for the hematopoietic colony-forming unit (CFU) assay

Catalog #
(Select a product)
Automated and standardized colony counting for the hematopoietic colony-forming unit (CFU) assay
Request Pricing
Add to Wish List
Products for Your Protocol
To see all required products for your protocol, please consult the Protocols and Documentation.

What Our Product Engineer Says

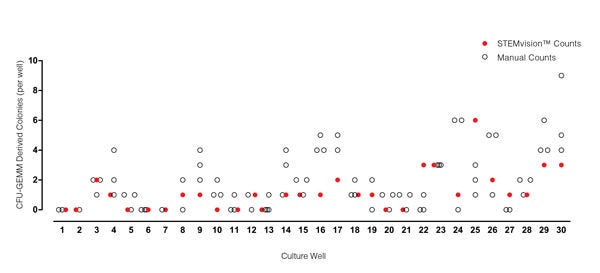
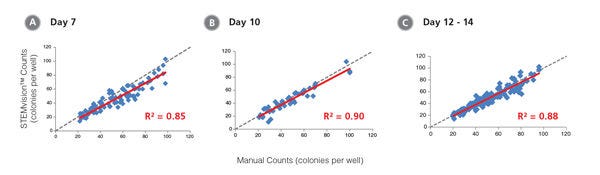
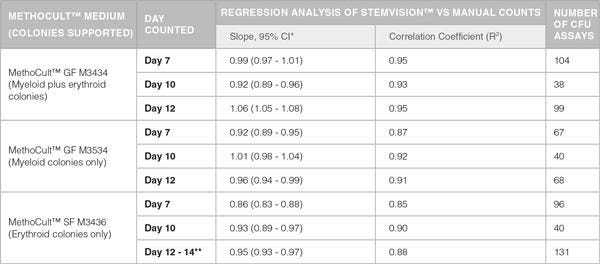
We developed STEMvision™ as our own "expert CFU counter in a box" and to remove some of the subjectivity inherent in counting colonies in a CFU assay. Using standardized algorithms helps to reduce variations that might be seen when different people are counting and scoring colonies manually.

Oliver EgelerSenior Systems Engineer
Oliver Egeler, Senior Systems Engineer

Overview

STEMvision™ consists of an instrument and software designed specifically for imaging and counting colonies in hematopoietic colony-forming unit (CFU) assays using MethoCult™ media and meniscus-free SmartDish™ cultureware. STEMvision™ software, known as Analysis Packages, replaces the need to manually count colonies using a microscope. With the addition of the STEMvision™ 21 CFR Part 11 Compliance Software Add-On (Catalog #500-0110), STEMvision™ can support workflows consistent with FDA Title 21 CFR Part 11 regulations on electronic records.

For human cultures, three Analysis Packages have been designed for scoring and counting hematopoietic colonies produced by erythroid, myeloid and multi-potential progenitor cells in 14-day assays of CB, BM and MPB cultured in MethoCult™ Optimum media. A fourth Analysis Package is also available for counting the total number of colonies in 7-day assays of CB cultured in MethoCult™ Express medium.

For mouse BM cultures, three Analysis Packages have been designed to count total numbers of hematopoietic colonies produced by all combined myeloid and erythroid progenitors in M3434, myeloid progenitors only in M3534 and erythroid progenitors only in M3436.

Selection of at least one Analysis Package is required for each instrument purchase. Additional Analysis Packages and software add-ons to support 21 CFR Part 11 compliance are sold separately. Select your preferred Analysis Package and select Request Pricing for further information. Several purchase and leasing options are available.

For more information about Instrument Services including additional service packages and installation software please see our instrumentation overview.

Browse our Frequently Asked Questions (FAQs) on performing the CFU assay and explore its utility as part of the cell therapy workflow.
Application
Colony Assay, Functional Assay, Genome Editing
Brand
STEMvision
Area of Interest
Cord Blood Banking, Stem Cell Biology, Transplantation Research, Cell Therapy Development

Data Figures

Representative STEMvision™ Images Showing Colonies Derived from CB Progenitors after 7 Days of Culture in MethoCult™ Express, and from CB, BM and MPB after 14 Days of Culture in MethoCult™ Optimum

Figure 1. Representative STEMvision™ Images Showing Colonies Derived from CB Progenitors after 7 Days of Culture in MethoCult™ Express, and from CB, BM and MPB after 14 Days of Culture in MethoCult™ Optimum

These images have been analyzed by STEMvision™ Human (A) 7-Day and (B-D) 14-Day Analysis Packages. Green circles identify individual colonies in a 7-day CB CFU assay that scores total CFUs only (A). Orange and red circles identify erythroid colonies, yellow circles identify myeloid colonies and blue circles identify mixed colonies in 14-day CB (B), BM (C) and MPB (D) CFU assays. Erythroid and mixed colonies that contain hemoglobinized cells are shown in true red color.

STEMvision™ Automated Counting of Total, Erythroid (BFU-E) and Myeloid (CFU-G/M/GM) Colonies Is Highly Correlated to Manual Counts of 14-Day CB CFU Assays

Figure 2. STEMvision™ Automated Counting of Total, Erythroid (BFU-E) and Myeloid (CFU-G/M/GM) Colonies Is Highly Correlated to Manual Counts of 14-Day CB CFU Assays

Cryopreserved CB cells were thawed, plated in MethoCult™ Optimum and cultured for 14 days. The resulting colonies were then counted both manually using an inverted microscope, and automatically using STEMvision™ with the Human CB 14-Day CFU Analysis Package (Catalog #22005). Gray dashed lines represent a perfect linear correlation between manual and automated counts. Red solid lines represent the actual linear correlation between manual and automated counts. The mathematical equations and correlation coefficients (R2) that describe each data set (n=130 CFU assays) are as follows: A: y=1.02x + 1.39, R2=0.96 for Total Colonies, B: y=1.05x + 1.53, R2=0.89 for BFU-E, C: y=0.99x + 0.13, R2=0.94 for CFU-G/M/GM.

STEMvision™ Automated Counting of Mixed Colonies Falls Within the Range of Manual Counts of 14-Day CB CFU Assays

Figure 3. STEMvision™ Automated Counting of Mixed Colonies Falls Within the Range of Manual Counts of 14-Day CB CFU Assays

Thirty individual 14-day CB CFU assays were counted by three to seven people. The numbers of mixed colonies (CFU-GEMM) colonies counted manually in each well are shown by the black open circles (n=80 total assay scores). Manual CFU-GEMM counts in most cultures varied significantly between individual people. STEMvision™ counts of the same cultures (red circles) provided a CFU-GEMM count that was typically within the range of manual counts.

STEMvision™ Automated Scoring of Total, Erythroid (BFU-E + CFU-E) and Myeloid (CFU-G/M/GM) Colonies Is Highly Correlated to Manual Counts of 14-Day BM CFU Assays

Figure 4. STEMvision™ Automated Scoring of Total, Erythroid (BFU-E + CFU-E) and Myeloid (CFU-G/M/GM) Colonies Is Highly Correlated to Manual Counts of 14-Day BM CFU Assays

Cryopreserved BM cells were thawed, plated in MethoCult™ Optimum, cultured for 14 days, and the resulting colonies then scored both manually using an inverted microscope and automatically using STEMvision™ with the Human BM 14-Day CFU Analysis Package (Catalog #22006). The BM Analysis Package can identify and count erythroid colonies produced by CFU-E and BFU-E separately, but these are combined in panel B. Gray dashed lines represent a perfect linear correlation between manual and automated counts. Red solid lines represent the actual linear correlation between manual and automated counts. The mathematical equations and correlation coefficients (R2) that describe each data set (n=120 CFU assays) are as follows: A: y=0.88x + 8.79, R2=0.95 for Total Colonies, B: y=0.83x + 6.71, R2=0.89 for CFU-E + BFU-E, C: y=0.92x + 2.55, R2=0.94 for CFU-G/M/GM.

STEMvision™ Automated Counting of Mixed Colonies Falls Within the Range of Manual Counts of 14-Day BM CFU Assays

Figure 5. STEMvision™ Automated Counting of Mixed Colonies Falls Within the Range of Manual Counts of 14-Day BM CFU Assays

Thirty individual 14-day BM CFU assays were counted by three to seven people. The numbers of mixed (CFU-GEMM) colonies counted manually in each well is shown by the black open circles (n=82 total assay scores). Manual CFU-GEMM counts in most cultures varied significantly between individual people. STEMvision™ counts of the same cultures (red circles) provided a CFU-GEMM count that was typically within the range of manual counts.

STEMvision™ Automated Counting of Total, Erythroid (BFU-E) and Myeloid (CFU-G/M/GM) Colonies Is Highly Correlated to Manual Counts of 14-Day MPB CFU Assays

Figure 6. STEMvision™ Automated Counting of Total, Erythroid (BFU-E) and Myeloid (CFU-G/M/GM) Colonies Is Highly Correlated to Manual Counts of 14-Day MPB CFU Assays

Cryopreserved MPB cells were thawed, plated in MethoCult™ Optimum, cultured for 14 days, and the resulting colonies then scored both manually using an inverted microscope and automatically using STEMvision™ with the Human MPB 14-Day CFU Analysis Package (Catalog #22007). Gray dashed lines represent a perfect linear correlation between manual and automated counts. Red solid lines represent the actual linear correlation between manual and automated counts. The mathematical equations and correlation coefficients (R2) that describe each data set (n=143 CFU assays) are as follows: A: y=0.97x + 2.44, R2=0.97 for Total Colonies, B: y=0.96x + 3.74, R2=0.91 for BFU-E, C: y=0.96x + 0.90, R2=0.95 for CFU-G/M/GM.

STEMvision™ Automated Scoring of Mixed Colonies Falls Within the Range of Manual Counts of 14-Day MPB CFU Assays

Figure 7. STEMvision™ Automated Scoring of Mixed Colonies Falls Within the Range of Manual Counts of 14-Day MPB CFU Assays

Thirty individual 14-day MPB CFU assays were counted by three to seven people. The numbers of mixed (CFU-GEMM) colonies counted manually in each well is shown by the black open circles (n=82 total assay scores). Manual CFU-GEMM counts in most cultures varied significantly between individual people. STEMvision™ counts of the same cultures (red circles) provided a CFU-GEMM count that was typically within the range of manual counts.

Representative STEMvision™ Images Showing Colonies Derived from Mouse BM Progenitors After 12 Days of Culture in MethoCult™ GF M3434, MethoCult™ GF M3534 or MethoCult™ SF M3436 Media

Figure 8. Representative STEMvision™ Images Showing Colonies Derived from Mouse BM Progenitors After 12 Days of Culture in MethoCult™ GF M3434, MethoCult™ GF M3534 or MethoCult™ SF M3436 Media

Images of mouse BM cells cultured in (A) MethoCult™ GF M3434, (B) MethoCult™ GF M3534 and (C) MethoCult™ SF M3436 were acquired using STEMvision™. The corresponding STEMvision™ Mouse Analysis Package (Table 1) was used to analyze each image. Red circles identify the smallest colonies - size class 1, yellow circles - size class 2, blue circles - size class 3 and orange circles identify the largest colonies - size class 4.

STEMvision™ Automated Counting is Highly Correlated to Manual Counting of Total (Myeloid Plus Erythroid) Colonies in Mouse BM CFU Assays

Figure 9. STEMvision™ Automated Counting is Highly Correlated to Manual Counting of Total (Myeloid Plus Erythroid) Colonies in Mouse BM CFU Assays

BM cells were plated in MethoCult™ GF M3434 (Catalog #03434/03444). Colonies were counted on days (A) 7, (B) 10 and (C) 12 both manually using an inverted microscope, and automatically using STEMvision™ equipped with the Mouse Total CFU Analysis Package (Catalog #22008). We recommend counting CFU assays of mouse progenitor cells plated in M3434 between 10 and 12 days. Gray dashed lines represent a theoretical perfect linear correlation between manual and automated counts. Red solid lines represent the actual linear correlation between manual and automated counts. The slope, 95% confidence intervals, correlation coefficients (R2) and sample size for each data set are provided in Table 1.

STEMvision™ Automated Counting is Highly Correlated to Manual Counting of Myeloid Colonies in Mouse BM CFU Assays

Figure 10. STEMvision™ Automated Counting is Highly Correlated to Manual Counting of Myeloid Colonies in Mouse BM CFU Assays

BM cells were plated in MethoCult™ GF M3534 (Catalog #03534). Colonies were counted on days (A) 7, (B) 10 and (C) 12 both manually using an inverted microscope, and automatically using STEMvision™ equipped with the Mouse Myeloid CFU Analysis Package (Catalog #22009). We recommend counting CFU assays of mouse myeloid progenitor cells plated in M3534 between 10 and 12 days. Gray dashed lines represent a theoretical perfect linear correlation between manual and automated counts. Red solid lines represent the actual linear correlation between manual and automated counts. The slope, 95% confidence intervals, correlation coefficients (R2) and sample size for each data set are provided in Table 1.

STEMvision™ Automated Counting is Highly Correlated to Manual Counting of Erythroid Colonies in Mouse BM CFU Assays

Figure 11. STEMvision™ Automated Counting is Highly Correlated to Manual Counting of Erythroid Colonies in Mouse BM CFU Assays

BM cells were plated in MethoCult™ SF M3436 (Catalog #03436). Colonies were counted on days (A) 7, (B) 10 and (C) 12 - 14 both manually using an inverted microscope, and automatically using STEMvision™ equipped with the Mouse Erythroid CFU Analysis Package (Catalog #22011). We recommend counting CFU assays of mouse erythroid progenitor cells plated in M3436 between of 10 to 14 days. Gray dashed lines represent a theoretical perfect linear correlation between manual and automated counts. Red solid lines represent the actual linear correlation between manual and automated counts. The slope, 95% confidence intervals, correlation coefficients (R2) and sample size for each data set are provided in Table 1.

Table 1. Correlation Between Automated STEMvision™ and Manual Colony Counting

Table 1. Correlation Between Automated STEMvision™ and Manual Colony Counting

*CI: Confidence Internal
**Mouse CFU assays of erythroid progenitor cells plated in M3436 should be counted between 10 to 14 days.

Protocols and Documentation

Find supporting information and directions for use in the Product Information Sheet or explore additional protocols below.

Document Type
Product Name
Catalog #
Lot #
Language
Document Type
Technical Manual
Product Name
STEMvision™
Catalog #
22000
Lot #
All
Language
English

Applications

This product is designed for use in the following research area(s) as part of the highlighted workflow stage(s). Explore these workflows to learn more about the other products we offer to support each research area.

Resources and Publications

Publications (6)

The NAD-Booster Nicotinamide Riboside Potently Stimulates Hematopoiesis through Increased Mitochondrial Clearance. N. Vannini et al. Cell stem cell 2019 mar

Abstract

It has been recently shown that increased oxidative phosphorylation, as reflected by increased mitochondrial activity, together with impairment of the mitochondrial stress response, can severely compromise hematopoietic stem cell (HSC) regeneration. Here we show that the NAD+-boosting agent nicotinamide riboside (NR) reduces mitochondrial activity within HSCs through increased mitochondrial clearance, leading to increased asymmetric HSC divisions. NR dietary supplementation results in a significantly enlarged pool of progenitors, without concurrent HSC exhaustion, improves survival by 80{\%}, and accelerates blood recovery after murine lethal irradiation and limiting-HSC transplantation. In immune-deficient mice, NR increased the production of human leucocytes from hCD34+ progenitors. Our work demonstrates for the first time a positive effect of NAD+-boosting strategies on the most primitive blood stem cells, establishing a link between HSC mitochondrial stress, mitophagy, and stem-cell fate decision, and unveiling the potential of NR to improve recovery of patients suffering from hematological failure including post chemo- and radiotherapy.
Validation of a semi automatic device to standardize quantification of Colony-Forming Unit (CFU) on hematopoietic stem cell products. M. Velier et al. Cytotherapy 2019 jun

Abstract

Accurate characterization of hematopoietic stem cells (HSC) products is needed to better anticipate the hematopoietic reconstitution and the outcome in patients. Although CD34+ viable cells enumeration is a key predictor of time to correction of aplasia, it does not fully inform about functionality of cells contained in the graft. CFU assay is the gold standard in vitro potency assay to assess clonogenicity of HSC and consists on the count and identification of colonies several days after culture in a semi solid media. Manual count of colonies with optic microscope is the most commonly used method but its important variability and subjectivity hinders the universal implementation of this potency assay. The aim of this study is to validate a standardized method using the STEMvision™ system, the first semi-automated instrument for imaging and scoring hematopoietic colonies, according to French and European recommendations. Results obtained highlight better performance criteria with STEMvision™ system than the manual method. This semi-automatic device tends to reduce the coefficients of variation of repeatability, inter-operator variability and intermediate precision. This newly available platform could represent an interesting option, significantly improving performances of CFU assays used for the characterization of hematopoietic progenitors.
TRIAMF: A New Method for Delivery of Cas9 Ribonucleoprotein Complex to Human Hematopoietic Stem Cells. J. Yen et al. Scientific reports 2018 NOV

Abstract

CRISPR/Cas9 mediated gene editing of patient-derived hematopoietic stem and progenitor cells (HSPCs) ex vivo followed by autologous transplantation of the edited HSPCs back to the patient can provide a potential cure for monogenic blood disorders such as $\beta$-hemoglobinopathies. One challenge for this strategy is efficient delivery of the ribonucleoprotein (RNP) complex, consisting of purified Cas9 protein and guide RNA, into HSPCs. Because $\beta$-hemoglobinopathies are most prevalent in developing countries, it is desirable to have a reliable, efficient, easy-to-use and cost effective delivery method. With this goal in mind, we developed TRansmembrane Internalization Assisted by Membrane Filtration (TRIAMF), a new method to quickly and effectively deliver RNPs into HSPCs by passing a RNP and cell mixture through a filter membrane. We achieved robust gene editing in HSPCs using TRIAMF and demonstrated that the multilineage colony forming capacities and the competence for engraftment in immunocompromised mice of HSPCs were preserved post TRIAMF treatment. TRIAMF is a custom designed system using inexpensive components and has the capacity to process HSPCs at clinical scale.
Now Available: STEMvision™ 21 CFR Part 11 Compliance Software Add-On (Catalog #500-0110). Request pricing above for more information.