eTeSR™
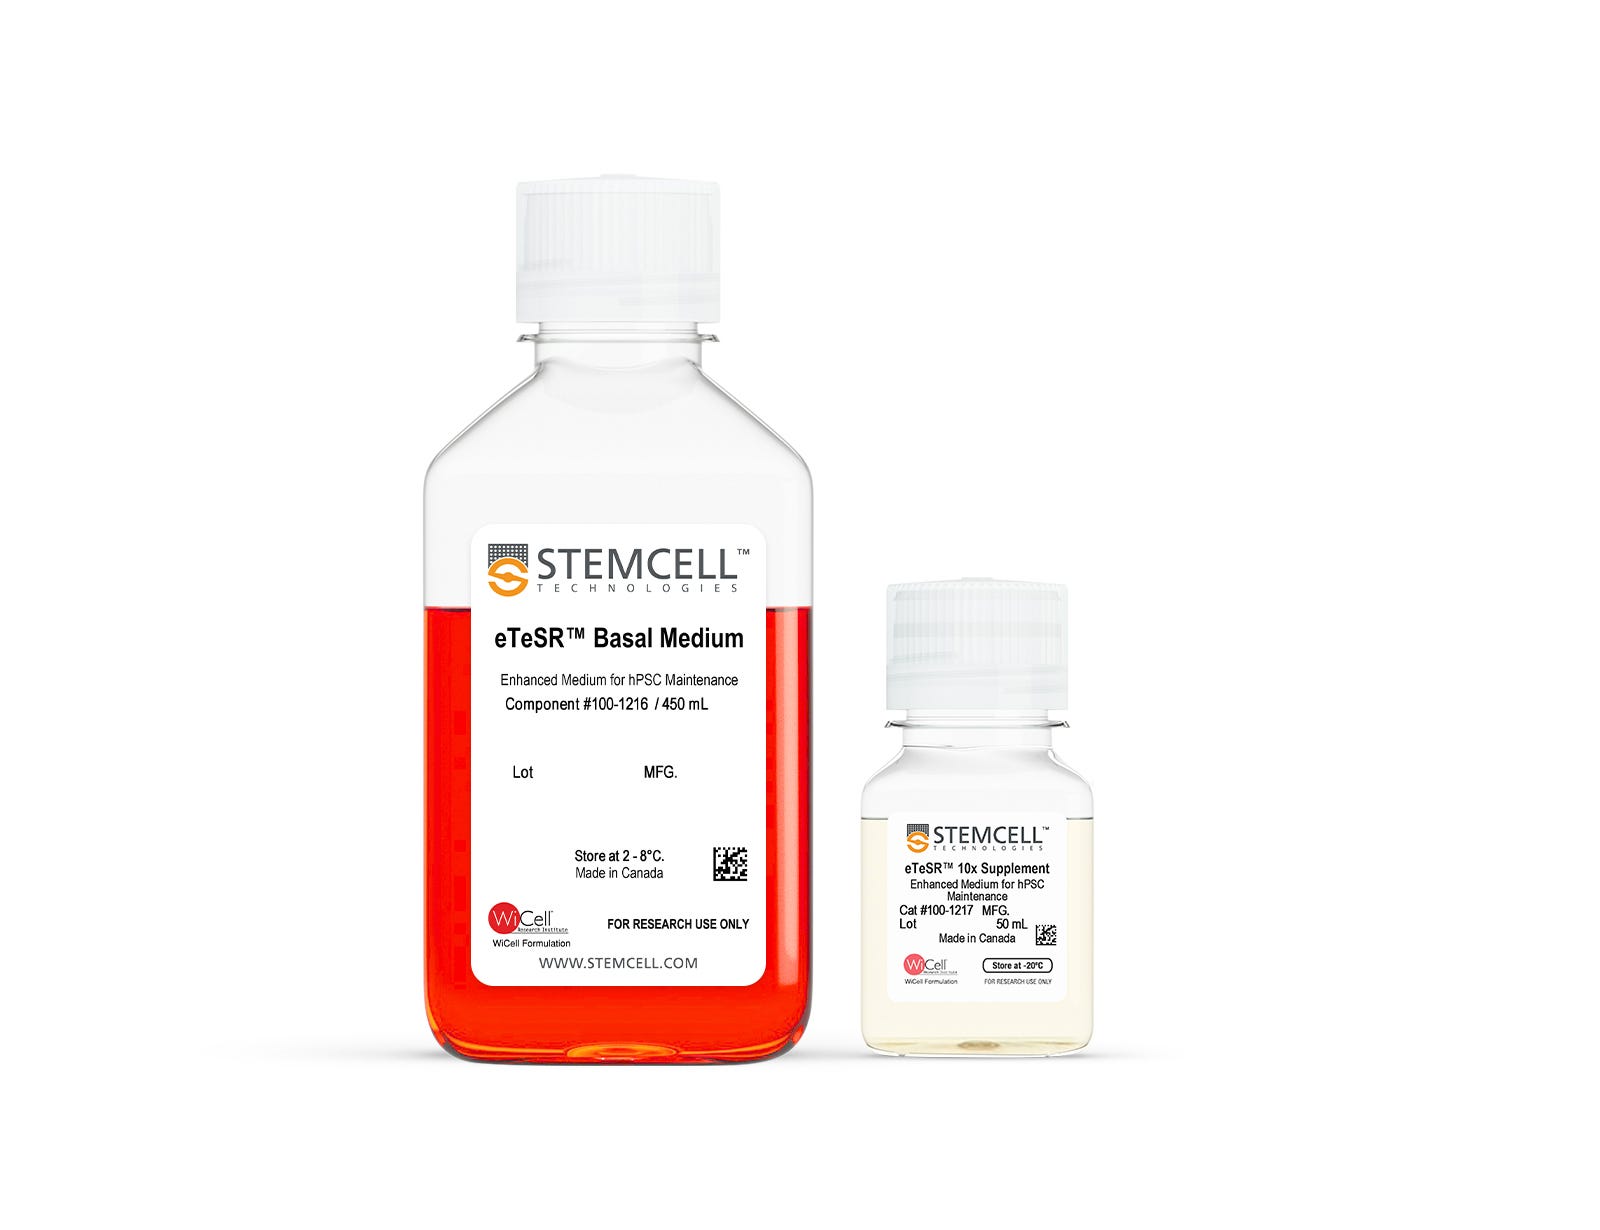
Stabilized, feeder-free medium for single-cell passaging of human pluripotent stem cells
Request Pricing
Thank you for your interest in this product. Please provide us with your contact information and your local representative will contact you with a customized quote. Where appropriate, they can also assist you with a(n):
Estimated delivery time for your area
Product sample or exclusive offer
In-lab demonstration
Overview
Specifically developed for single-cell applications, which typically involve shorter passaging schedules at high density, eTeSR™ can be used for routine maintenance, gene editing, or cloning workflows. Use eTeSR™ to produce high-quality hPSCs with improved genetic stability for these applications; stabilization of the components (e.g. FGF2), optimized metabolites, and improved buffering capacity address the increased metabolic demand and cell stress associated with single-cell passaging. Expect equivalent high performance when using eTeSR™ with either daily or restricted feeding schedules.
eTeSR™ is compatible with a variety of cell culture matrices, including Corning® Matrigel® hESC-Qualified Matrix (Corning Catalog #354277) and CellAdhere™ Laminin-521 (Catalog #200-0117).
Each lot of eTeSR™ 10X Supplement is quality-tested in a culture assay using hPSCs.
Data Figures
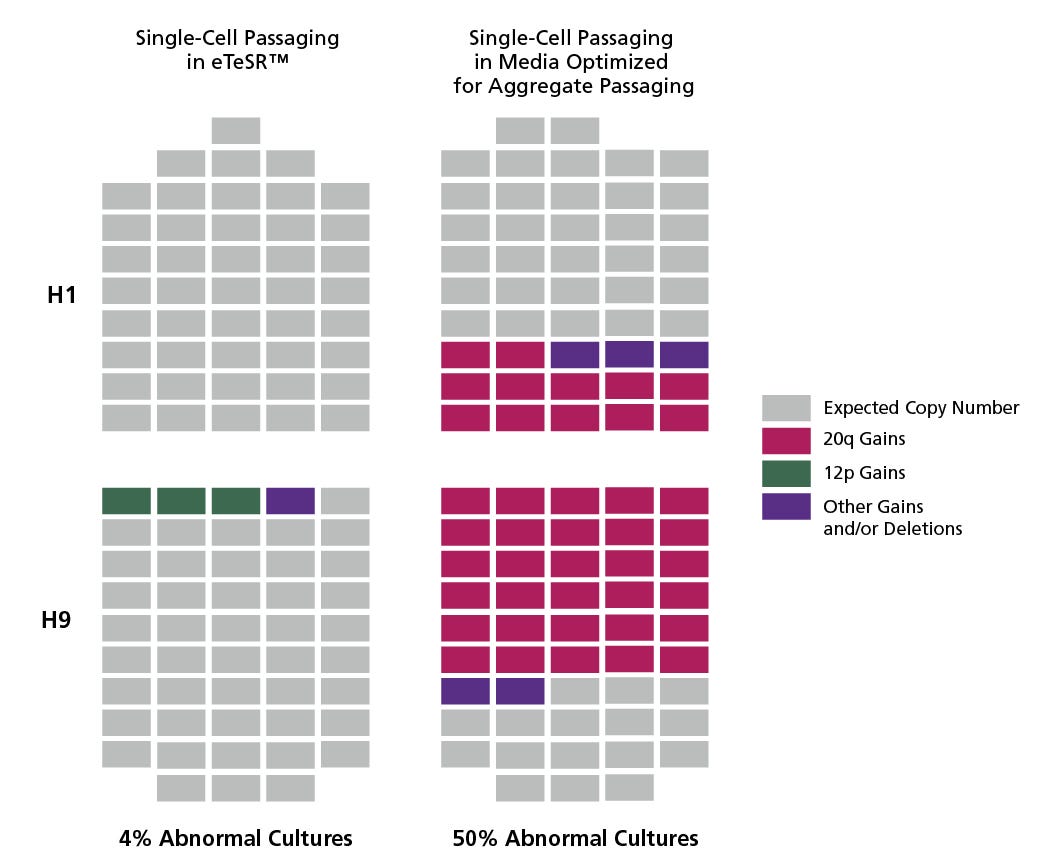
Figure 1. eTeSR™ Improves the Genetic Stability of hPSC Cultures Maintained Long-Term Using Single Cell Passaging
Individual clonal sub-lines were derived from H1 and H9 hPSC lines using single-cell deposition. Clones (represented by each rectangle) were screened for recurrent abnormalities using the hPSC Genetic Analysis Kit prior to initiating long-term single-cell passaging experiments. Clones from each line were then cultured for 20 weeks (30 passages) using an automated platform in either eTeSR™ or media developed and optimized for aggregate passaging. After 20 weeks, clones were screened again using the hPSC Genetic Analysis Kit and any 20q and 12p abnormalities detected were confirmed using FISH. hPSCs cultured with routine single-cell passaging demonstrated significantly fewer clones (4% vs. 50%) that developed common recurrent abnormalities when maintained in eTeSR™, compared to media optimized for aggregate-based passaging.

Figure 2. hPSCs Cultured As Single Cells in eTeSR™ Exhibit Improved Cell Expansion and Attachment
(A) Representative culture morphology of undifferentiated human ES (H9) and iPS cell lines (SCTi003-A and WLS-1C) maintained in eTeSR™ using single-cell passaging on Corning® Matrigel®-coated plates. hPSCs maintained in eTeSR™ display a homogeneous morphology that is consistent between hPSC lines. (B) Four hPSC lines were single-cell passaged in either mTeSR™1, mTeSR™ Plus, or eTeSR™ on Corning® Matrigel®-coated plates using TrypLE™ Express for 11 passages. Cultures were maintained using a 4-5-5 day passaging schedule (see manual) using a restricted feeding schedule for mTeSR™ Plus and eTeSR™, and daily feeding for mTeSR™1. eTeSR™-maintained cultures show improved expansion rates compared to mTeSR™1 and mTeSR™ Plus when using single-cell passaging. (C) Representative whole-well images of the STiPS-R038 hPSC line 24 hours post-plating stained with Hoechst 33342. hPSCs were seeded at 15,000 cells/well in either mTeSR™1, mTeSR™ Plus, or eTeSR™ supplemented with 10 μM Y-27632 on Matrigel®-coated 96-well plates. Plates were fixed, stained for Hoechst 33342, and imaged using the IXM Micro (Molecular Devices).
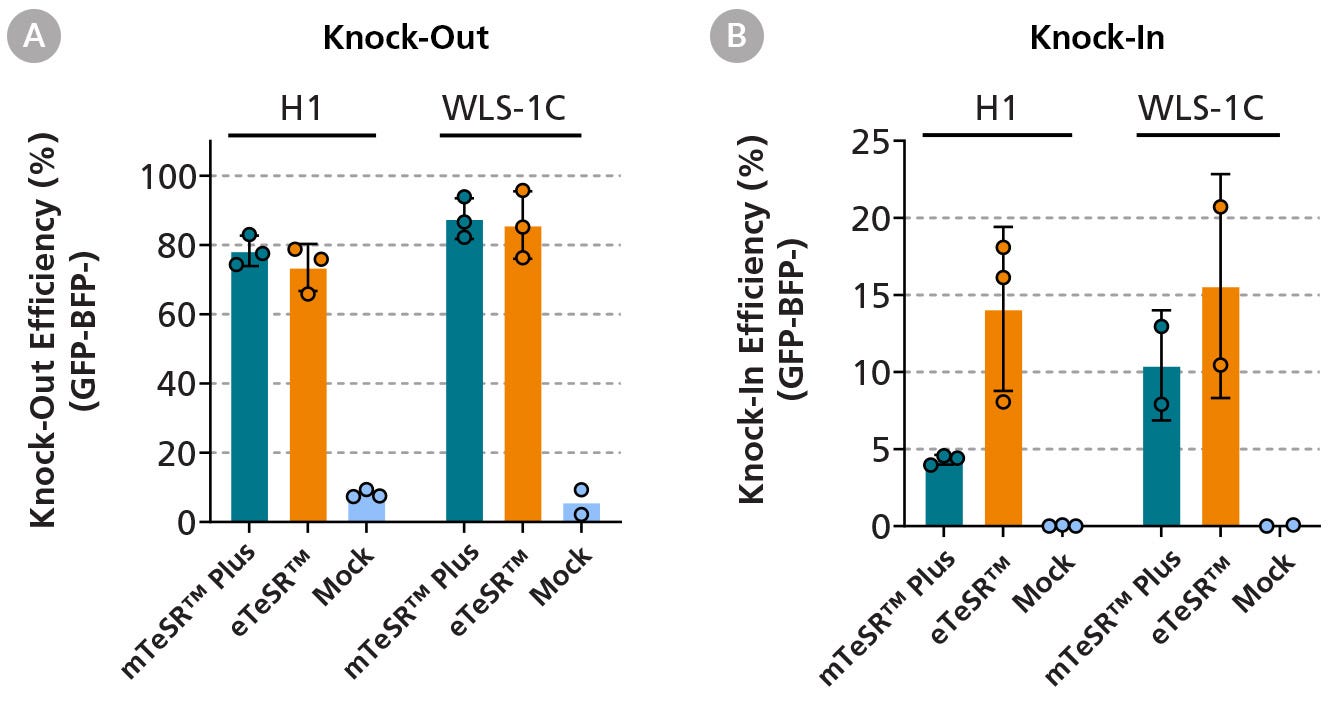
Figure 3. eTeSR™ Supports Efficient Gene-Editing in hPSCs
Using the ArciTect™ CRISPR-Cas9 system, GFP-labeled hPSC lines (H1 and WLS-1C) were electroporated in the presence of a ribonucleic protein (RNP) complex consisting of Cas9 and a guide RNA targeting the GFP sequence. A donor template was also included encoding a two base pair change, resulting in the conversion of the GFP sequence to a BFP sequence, which can be determined using flow cytometry. Data points in the graph represent the gene-editing outcomes of three independent experiments. Both knock-out (A) and knock-in (B) conditions show effective gene-editing with eTeSR™-maintained cultures, displaying a higher knock-in efficiency compared to mTeSR™ Plus-maintained cultures. The mock condition shows eTeSR™-maintained cells that have been incubated with the RNP complex and donor template but have not been electroporated. Error bars represent standard deviation of replicates.
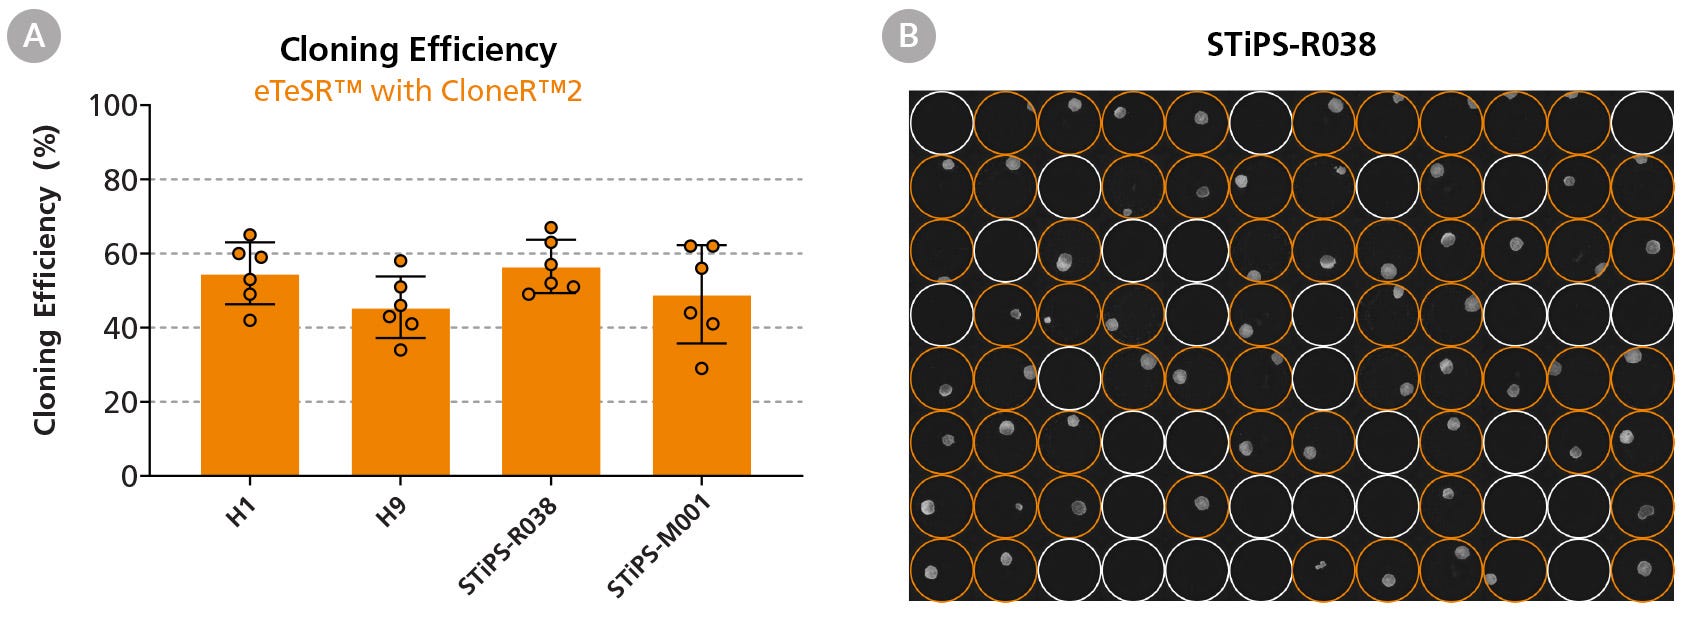
Figure 4. High Cloning Efficiencies Are Achieved Following Single-Cell Deposition Using eTeSR™ Supplemented with CloneR™2
(A) Four hPSC lines were seeded at 1 cell/well using single-cell deposition in eTeSR™ supplemented with CloneR™2 on Vitronectin-XF™-coated 96-well plates. Each data point represents one 96-well plate over three independent experiments. The average cloning efficiency across all four cell lines in eTeSR™ was 51 ± 3%. (B) Representative 96-well plate imaged at Day 8 post-plating, showing colonies generated in eTeSR™ using single-cell deposition. Orange circles highlight wells with a colony present.
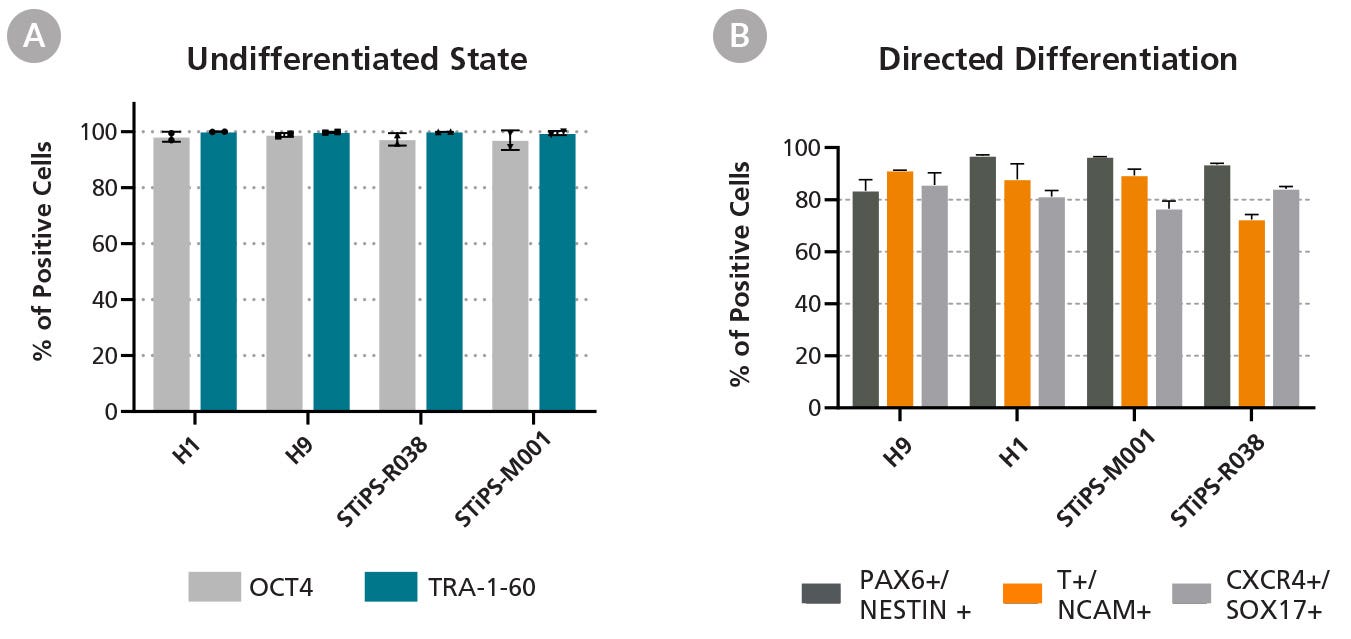
Figure 5. hPSCs Maintained in eTeSR™ Express Markers of the Undifferentiated State and Differentiate Efficiently to Three Germ Layers
(A) hPSCs maintained in eTeSR™ express markers of the undifferentiated state with > 98% of cells staining positive for OCT4 and TRA-1-60, as determined by flow cytometry at passage 12 and 20. Data points represent the percent positive at each time point with bars representing the average over the two time points for each cell line (n = 4 cell lines). (B) Four hPSC lines were maintained in eTeSR™ for at least 7 passages before being differentiated toward the three germ layers using the STEMdiff™ SMADi Neural Induction Kit, STEMdiff™ Mesoderm Induction Medium, and STEMdiff™ Definitive Endoderm Kit. All hPSC lines demonstrated efficient differentiation to all three lineages. Error bars represent the mean and standard deviation of three technical replicates.
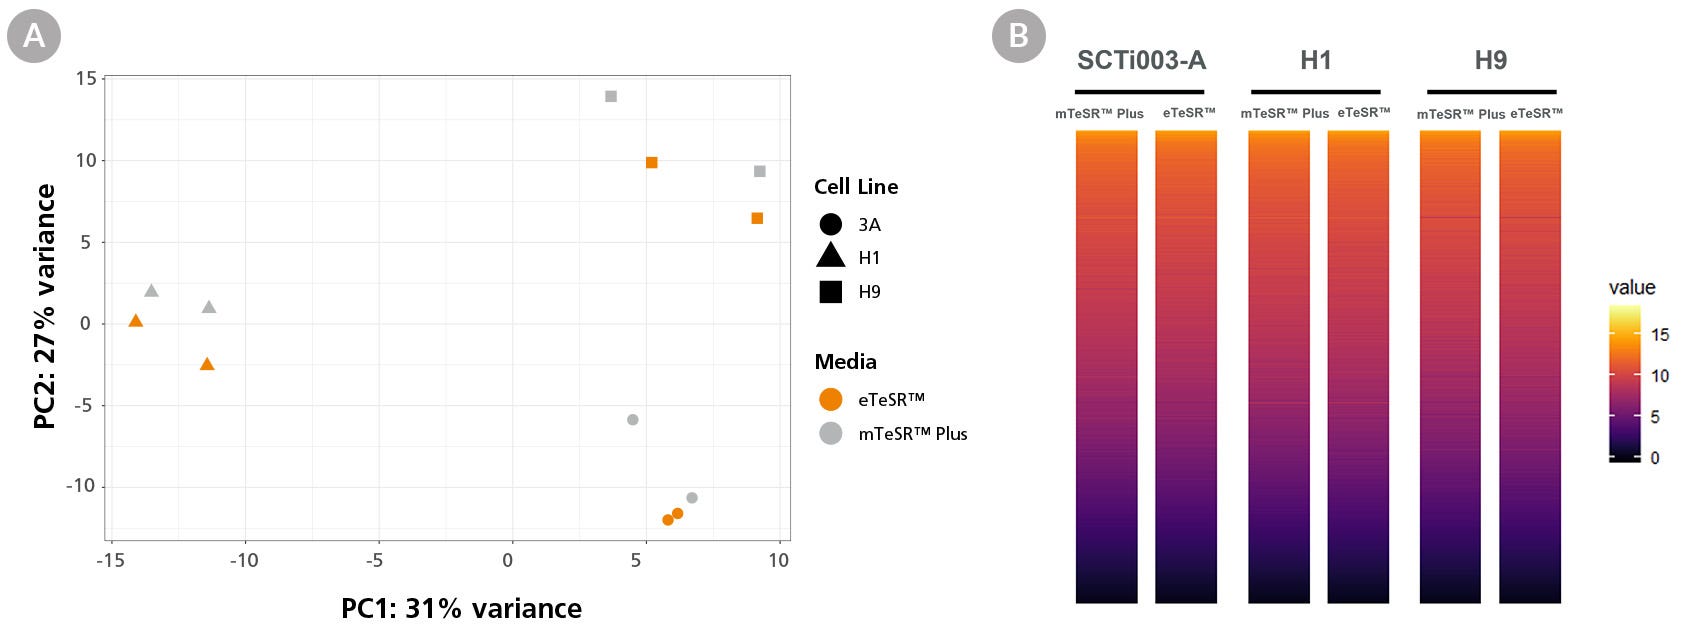
Figure 6. Global Gene Expression Profiles Are Comparable Between eTeSR™ Single-Cell Passaged Cultures and mTeSR™ Plus Aggregate Passaged Cultures
Whole transcriptome analysis was performed using the Illumina NextSeq 500 on three hPSC lines passaged as either aggregates in mTeSR™ Plus or as single cells in eTeSR™. (A) PCA analysis shows that samples cluster by cell line with minimal effect from cell culture medium and passaging technique. (B) A heat map of global gene expression showing comparable gene expression between conditions. No gene ontology or signaling pathway enrichment was detected (n = 3 hPSC lines).

Figure 7. hPSCs Maintained in eTeSR™ Can Be Differentiated to Cerebral Organoids with the STEMdiff™ Cerebral Organoid Kit
(A) H9 and SCTi003-A cells maintained in eTeSR™ or mTeSR™ Plus were differentiated to cerebral organoids using the STEMdiff™ Cerebral Organoid Kit (Catalog #08570). RT-qPCR analysis showed that PAX6, MAP2 and TTR gene expression were similar between eTeSR™ and mTeSR™ Plus. Each point represents an individual organoid sample and bars represent mean ± standard error. (B) Day 60 cerebral organoids from SCTi003-A cells were stained for CTIP2 (green), and PAX6 (magenta), MAP2 (blue). Cortical regions are defined by PAX6 positive progenitor cells. These progenitors give rise to cortical plate neurons indicated by CTIP2 and MAP2 expression. Scale bar: 500 µm. Magnification 100X.

Figure 8. hPSCs Maintained in eTeSR™ Differentiate to Forebrain-Type Neurons Using the STEMdiff™ Forebrain Neuron Differentiation Kit with Monolayer Protocol
SCTi003-A (data shown) and STiPS-M001 (data not included) cells maintained in eTeSR™ or mTeSR™ Plus were differentiated to forebrain neurons using the STEMdiff™ Forebrain Neuron Differentiation Kit (Catalog #08600). At Day 14 of maturation, neuronal morphology was observed (top panels; scale bar 200 µm). The resulting cultures (bottom panels; scale bar: 500 µm) contained populations of TuJ1 (class III β-tubulin; red) positive neurons. Nuclei are labeled with DAPI (blue).

Figure 9. hPSCs Maintained in eTeSR™ Can Be Differentiated to Midbrain Neurons Using the STEMdiff™ Midbrain Neuron Differentiation Kit with Monolayer Protocol
SCTi003-A (data shown) and STiPS-M001 (data not included) cells maintained in eTeSR™ or mTeSR™ Plus were differentiated to midbrain neurons using the STEMdiff™ Midbrain Neuron Differentiation Kit (Catalog #100-0038). At Day 14 of maturation, neuronal morphology was observed (top panels; scale bar 200 µm). The resulting cultures (bottom panels; scale bar: 500 µm) contained populations of TuJ1 (class III β-tubulin; red) positive neurons that express the dopaminergic marker Tyrosine Hydroxylase (TH; green). Nuclei are labeled with DAPI (blue).

Figure 10. hPSCs Maintained in eTeSR™ Can Be Differentiated to Intestinal Organoids Using the STEMdiff™ Intestinal Organoid Kit
(A) H9 cells maintained in eTeSR™ progress through the three-stage differentiation process to generate human intestinal organoids using the STEMdiff™ Intestinal Organoid Kit (Catalog #05140). At Day 8, following mid-/hindgut induction, efficient spheroid formation is observed. Collected spheroids, embedded in the extracellular matrix, can be maintained and expanded for several passages (P0-P2). Scale: 1 mm. (B) At Day 13 (P2), organoids from H9 and SCTi003-A cells expressed markers of the intestinal epithelium EPCAM, cell proliferation marker Ki67, and KRT20 for more differentiated epithelial cell types. Expression of markers associated with epithelial cells (β-catenin), enteroendocrine cells (CHGA), small intestine lining (SI), and goblet cells (MUC2) were also observed in these organoids. Scale bar: 100 µm. (C) RT-qPCR analysis showed similar gene expression for CDX2, ALPi (intestinal Alkaline Phosphatase), MUC2, and CHGA markers between the intestinal organoid generated from the eTeSR™- and mTeSR™ Plus-maintained hPSCs. Data are reported as mean ± standard deviation and each point represents a technical replicate. for the three technical replicates.

Figure 11. hPSCs Maintained in eTeSR™ Can Be Differentiated to Hepatocyte-Like Cells Efficiently Using the STEMdiff™ Hepatocyte Kit
(A) WLS-1C and SCTi003-A cells, maintained in eTeSR™ or mTeSR™ Plus, were differentiated to hepatocyte-like cells (HLCs) using the STEMdiff™ Hepatocyte Kit (Catalog #100-0520) and analyzed by flow cytometry on Day 21 for expression of mature hepatocyte markers, ALB and A1AT. Percentages and total number of cells expressing ALB and A1AT following differentiation are shown, with data expressed as mean ± standard error. At Day 21, 70% of HLCs derived from eTeSR™-maintained hPSCs were ALB+/A1AT+. (B) Day 21 HLCs derived from SCTi003-A were fixed with 4% paraformaldehyde and permeabilized before being stained with mature hepatocyte marker ALB (green), epithelial marker EPCAM (red), and DAPI (blue). Characteristic polygonal hepatocyte-like morphology and binucleation are observed in both conditions.

Figure 12. hPSCs Maintained in eTeSR™ Can Be Differentiated to Ventricular Cardiomyocytes Efficiently and Robustly Using the STEMdiff™ Ventricular Cardiomyocyte Differentiation Kit
(A) SCTi003-A, H9 and WLS-1C cells maintained in eTeSR™ were differentiated to ventricular cardiomyocytes using the STEMdiff™ Ventricular Cardiomyocyte Differentiation Kit (Catalog #05010). By Day 16, cells from all three lines were differentiated to ventricular cardiomyocytes, as shown in the phase images (Scale bar 500 µm). (B) Ventricular cardiomyocytes from SCTi003-A cells were stained for cTnT markers (Red) and DAPI (left panel; scale bar: 25 µm). Flow cytometry analysis (right panel) showed that cell populations positive for cTnT were observed in all three hPSC lines. Data are expressed as mean ± standard deviation. (C) Cardiomyocytes, derived from SCTi003-A cells maintained in eTeSR, display the characteristic electrical microelectrode array (MEA) electrical profile of ventricular cardiomyocytes. Stable beat rate is observed with a large depolarization spike followed by a smaller repolarization deflection.
Protocols and Documentation
Find supporting information and directions for use in the Product Information Sheet or explore additional protocols below.
Applications
This product is designed for use in the following research area(s) as part of the highlighted workflow stage(s). Explore these workflows to learn more about the other products we offer to support each research area.
Resources and Publications
Educational Materials (11)
Related Products
-
 ACCUTASE™
Cell detachment solution
-
 CloneR™2
Defined supplement for improving survival of human ES and iPS cells in single-cell workflows
-
 Healthy Control Human iPSC Line, Female, SCTi...
Human pluripotent stem cell line, frozen
-
 CellAdhere™ Laminin-521
Matrix for maintenance of human ES and iPS cells in combination with TeSR™ maintenance media
Item added to your cart

eTeSR™
This product was developed under license to intellectual property owned by WiCell™ Research Institute. This product is sold for research use only (whether the buyer is an academic or for-profit entity) under a non-transferable, limited-use license. Purchase of this product does not include the right to sell, use or otherwise transfer this product for commercial purposes (i.e., any activity undertaken for consideration, such as use of this product for manufacturing, or resale of this product or any materials made using this product, or use of this product or any materials made using this product to provide services) or clinical use (i.e., administration of this product or any material using this product to humans) or the right to implant any material made using this product into an animal by, or in collaboration with, a for-profit entity, for purposes other than basic pre-clinical research applications (including without limitation teratoma assays) to validate the function of the cells.
PRODUCTS ARE FOR RESEARCH USE ONLY AND NOT INTENDED FOR HUMAN OR ANIMAL DIAGNOSTIC OR THERAPEUTIC USES UNLESS OTHERWISE STATED. FOR ADDITIONAL INFORMATION ON QUALITY AT STEMCELL, REFER TO WW.STEMCELL.COM/COMPLIANCE.


