Flow Cytometry Methods for Identifying Mouse Hematopoietic Stem and Progenitor Cells
Technical Bulletin describing how to use flowcytometry to phenotype mouse hematopoietic stem and progenitor cells.
- Document # 27103
- Version 1.1.0
- Aug 2018
Background
The phenotypic characterization of mouse hematopoietic stem and progenitor cells (HSPCs), combined with functional cell-based assays, has greatly improved our understanding of the relationships between hematopoietic stem cells (HSCs), progenitor cells, and mature blood cells. The hematopoietic system is hierarchical in nature, with multipotent long-term HSCs (LT-HSCs) existing at the highest point on a branched hierarchy consisting of more proliferative progenitors further down the tree. While this relatively simple model has recently been challenged,1-3 the fact remains that primitive HSPC subpopulations are uniquely responsible for generating the billions of mature blood cells that must enter the circulation every day. To regulate these tremendous demands, strict intrinsic and extrinsic mechanisms are in place to control HSC cycling, self-renewal, and differentiation. In order to properly study the complex mechanisms controlling these important cell populations, scientists require methods to identify, isolate, and quantify HSPCs.
LSK Cells
Several commonly used methods for phenotyping and purifying mouse HSPCs have relied on the co-expression of c-Kit and Sca1 cell surface proteins, combined with an absence of lineage (Lin) markers that are typically present on mature blood cells such as T and B lymphocytes, NK cells, granulocytes, macrophages/ monocytes, and red blood cells.4 All multipotent hematopoietic cells are encompassed within the Lin-Sca1+c-Kit+ (LSK) fraction of the bone marrow (BM), however, the frequency of true HSCs within this population is only about 10%. Moreover, this phenotype is only appropriate for identifying HSPCs present in steady-state adult BM of certain mouse strains, e.g. C57Bl/6. Additionally, the LSK phenotype is not useful in other mouse strains, e.g. Balb/c, or if HSPCs are activated and proliferating (particularly upon in vitro culture), or from earlier timepoints of mouse embryonic development.5-7
LSK/SLAM and ESLAM Phenotypes
The development of the SLAM code of markers, adjudicated by
the markers CD150 and CD48, represented a major improvement
for further enrichment of the LSK population of mouse HSPCs.
The frequency of true HSCs within the CD150+CD48- LSK
(LSK/SLAM) population is about 40% in normal adult mouse BM.8
This phenotype also enables improved resolution of HSCs in various
experimental contexts and from embryonic sources.7,9 The ESLAM
phenotype (CD45+EPCR+CD150+CD48-) is notable as it does not use
the traditional LSK panel. Instead, the SLAM markers are combined
with the endothelial cell protein C receptor (EPCR) to increase the
purity of isolated HSPCs.10,11 Inclusion of the CD45 marker in this panel enables the exclusion of contaminating endothelial cells which, along with other cells, express EPCR, and helps standardize
gates for flow cytometric-based analyses.12
Historically it has been difficult to perform phenotypic
analyses of different HSPC subsets due to their low frequency
(< 1 in 10,000 cells in BM), absence of specific cell surface markers,
and innate functional heterogeneity. The continued evolution
of flow cytometers, together with an increasing number of
monoclonal antibodies and new fluorochromes to which these can
be conjugated, has made methods for studying rare HSPC subsets
more readily available.
This technical bulletin describes a general overview of methods
for phenotyping LSK, LSK/SLAM, and ESLAM HSPCs from adult
C57Bl/6 mouse BM using panels of fluorochrome-conjugated
monoclonal antibodies (Tables 1 - 3). Tips for cell preparation and
experimental design, including choosing fluorochromes and setting
up proper controls, are also provided.
Flow Cytometry Considerations
Several technical aspects must be considered when performing multicolor flow cytometry experiments to identify rare populations of HSPCs.13
Choice of Fluorochrome
Given the many different configurations of lasers, band-pass
filters, and detectors that exist in modern flow cytometers, it
is critical to optimize antibody panels specifically for the user’s
particular instrument. It is preferable to use fluorochromes with
high fluorescence intensities to facilitate the detection of antigens
that are expressed at low levels, and conversely to reserve
fluorochromes with weaker fluorescence levels to detect markers
that are expressed at high levels. Proper titration experiments will
help optimize concentrations and combinations of conjugated
antibodies to be used together in a phenotyping panel.
The phenotyping panels described in Tables 1 - 3 include a cocktail
of Lin markers conjugated to FITC, or an anti-CD45 antibody
conjugated to Alexa Fluor® 488. As the relative fluorescence
intensities of FITC and Alexa Fluor® 488 are significantly lower
than most other fluorochromes, the antigens chosen for detection
with these reagents are expressed at high levels. Additionally,
although flow cytometry analysis software can automatically
compensate overlap between fluorescence channels, it is still important to minimize spectral overlap when choosing an
antibody/fluorochrome combination, as this can impact the ability
to detect the population of interest.
As no single specific marker exists for this population, HSPC
subsets must be identified by the expression of combinations of
markers. Although some high-end flow cytometers can detect up
to 18 distinct fluorescence signals, inclusion of many fluorochromes
into a phenotyping panel can make experimental design and
data analysis difficult. One approach to keep the number of
fluorochromes manageable is the use of a common channel to
exclude cells that are not of interest, specifically mature blood cells
and “late” progenitor cells that express Lin antigens such as CD3,
CD11b, CD45R, Gr-1, and Ter119. Adult mouse HSPCs either lack
or express only very low levels of Lin markers. Antibodies used to
detect these antigens are all conjugated to FITC. In the examples
shown in Figures 1 and 2, FITC-conjugated antibodies against a
panel of Lin antigens were combined in a single panel to allow
detection of the unwanted Lin+ cells in one fluorescence channel.
This frees up the other channels to distinguish HSPC subsets using
other, more important markers in the staining panel.14
Staining Controls
Two types of controls are required to validate a multicolor flow
cytometry panel: (i) “setup” controls, which consist of
an unstained sample and single antibody-stained controls, and
(ii) “gating” controls, also known as “fluorescence-minus-one”
(FMO) controls.14,15
Setup controls are used to properly establish various cytometer
parameters by facilitating the establishment of photomultiplier
tube (PMT) voltage gains and determining the levels of spectral
overlap between fluorescent reagents. Unstained cells help set PMT
voltage settings and define boundaries to gate out dead cells, but
their background fluorescence can differ from cells that have been
stained with multiple reagents.11 Single antibody-stained controls
consist of cells stained separately with a single fluorescently labeled
antibody. The use of these controls ensures that other reagents in
the mix do not adversely affect the fluorescence of the antibody
in question.
The use of matching isotype control antibodies, which were
historically implemented in multicolor flow cytometry, are now
considered to provide little value as they can differ in their
background staining from the test reagents they are meant to be
compared to.
FMO controls combine all antibodies except for the one of
interest. These controls measure the specific fluorescence of a
given fluorochrome in the context of other reagents present in the
cocktail. They also serve as an important control when setting up
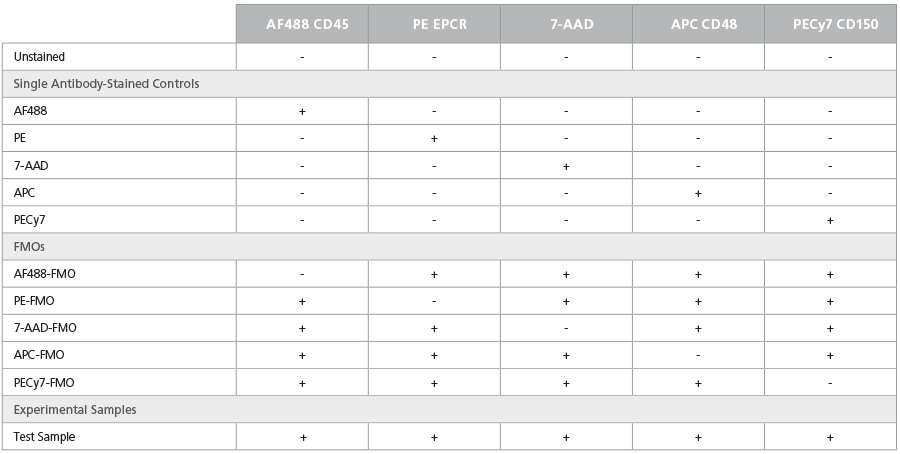
gates to analyze target populations. Tables 4, 5, and 6 include FMO
controls for the staining panels described in Tables 1, 2, and 3,
respectively. Overall, once a phenotyping panel has been confirmed
and validated, it may not be necessary to run all FMO and single
antibody-stained controls on a routine basis, thus allowing one to
conserve cells in small samples and reduce workload.
For both control and test samples, non-specific staining can
be reduced by pre-incubating cells with serum (at ~10% v/v
concentration) from the same species as the test antibodies and/or
using an anti-CD16/32 antibody to block Fc receptor binding.
Compensation
Ideally, cells from the test sample will be used for all of the aforementioned controls. This provides the most accurate context for setting of PMT voltages and interpreting the fluorescence signals observed. However, using cells from precious experimental samples can be difficult when cell numbers are limited, when there are differences in autofluorescence between various cell subsets, or when the target population represents a very small percentage of the bulk population.13 Compensation beads provide an excellent alternative to the use of cells for setup controls. Commercially available compensation beads bind antibodies with high affinity and thus emit a high fluorescence signal with a low coefficient of variation. To provide an optimal fluorescence signal it is important to titrate the amount of all antibodies.
HSPC Phenotyping Panels
Table 1. Mouse LSK Phenotyping Panel
Table 2. Mouse LSK/SLAM Phenotyping Panel
Table 3. Mouse ESLAM Phenotyping Panel
Table 4. Staining Matrix for the LSK Phenotyping Panel
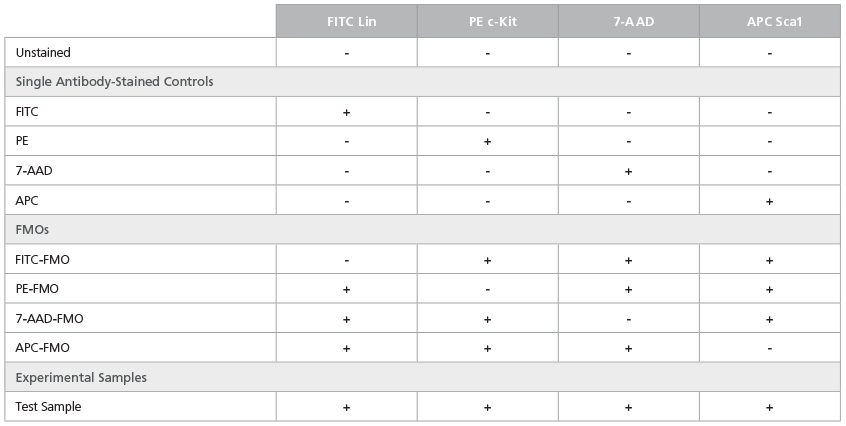
Table 5. Staining Matrix for the LSK/SLAM Phenotyping Panel
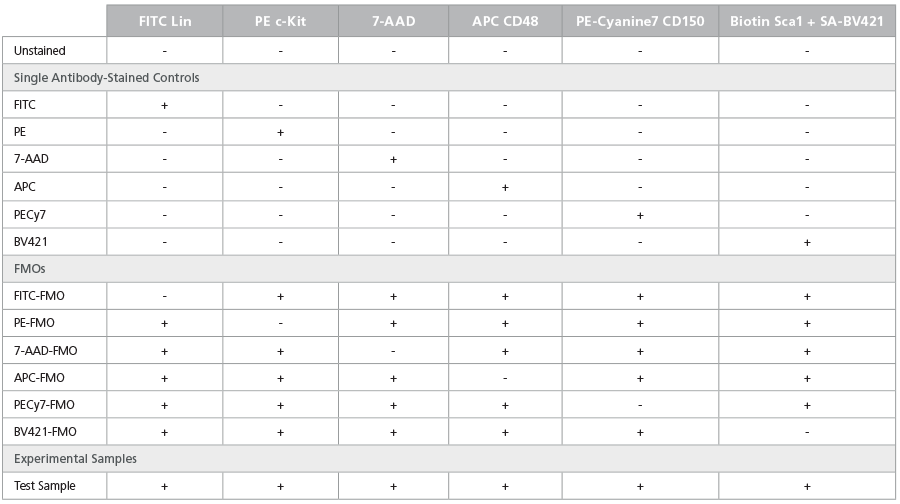
Table 6. Staining Matrix for the ESLAM Phenotyping Panel
How to Isolate and Stain Mouse Bone Marrow Cells for Flow Cytometry
To isolate, prepare, and stain BM cells for flow cytometric analysis of HSPCs, follow the general protocol below:
- Isolate cells from mouse femora and tibiae by flushing bones with 1 - 3 mL phosphate-buffered saline (PBS) (without Mg2+ and Ca2+) supplemented with 5 mM EDTA plus 1% fetal calf serum. Flushing may be done using a 21 - 26G needle attached to a 1 - 10 mL syringe.
- Generate a single-cell suspension by gently triturating the cells
through the needle until large clumps are no longer present.
Note: The number of harvested BM cells can be increased by including other bones such as the iliac crest or the spinal column. Crushing the bones using a mortar and pestle has also been shown to significantly improve the recovery of LSK cells.14 - Lyse red blood cells (RBCs) by adding cold ammonium chloride solution and incubating BM cells on ice for 10 minutes.
- Following RBC lysis, top up the sample with an appropriate volume of PBS or similar wash buffer, and centrifuge at 300 x g for 5 minutes at room temperature (RT; 15 - 25°C). Resuspend the cell pellet in PBS and filter through a 70 μm filter to remove aggregated cell clumps and debris.
- Count the cells in the filtered suspension and dilute to 1 x 10⁷ cells/mL in the same medium. The expected recovery of nucleated cells from both tibiae and femora (i.e. 4 long bones) of a normal male C57Bl/6 mouse is approximately 4 - 5 x 10⁷ cells.
- To reduce non-specific binding of fluorescent antibodies, block Fc receptors by incubating cells with anti-CD16/32 (clone 2.4G2) antibody and 10% rat serum for 10 minutes on ice.
- For single antibody-stained controls, aliquot 3 x 10⁴ cells per tube and stain with optimized concentrations of individual antibodies in a total volume of ~100 μL.
- In parallel, set up FMOs and test samples by aliquoting 2 - 3 x 10⁶ cells per tube and stain with optimized concentrations of antibodies.
- Incubate cells for 20 minutes on ice, in the dark.
- Wash cells in an appropriate volume of PBS and centrifuge at 300 x g for 5 minutes at RT, then aspirate the supernatant.
- Resuspend cells in 100 μL PBS.
- Just prior to acquisition, add 1 μg/mL 7-AAD to all samples,
except unstained, single antibody-stained, and 7-AAD-FMO
controls. Addition of 7-AAD to separate unstained and single
antibody-stained controls should be considered if there are many dead or apoptotic cells that can cause increased
autofluorescence or non-specific staining.
Note: This general protocol uses 7-AAD to detect non-viable cells, but other viability dyes such as propidium iodide (PI) or amine-reactive dyes may also be used. - If using compensation beads, stain controls according to the manufacturer’s directions. To provide an optimal fluorescence signal, it is important to titrate the antibody so that the highest staining index is achieved.
- Typically 1 x 10⁴ events are acquired for unstained and single antibody-stained controls. The minimum number of events to be aquired from multiply-stained samples can vary, however, since the frequency of the various HSPC subpopulations within the BM is typically very low, it is helpful to acquire a large number of events (as many as a million or more may be necessary for small HSPC subsets).
Flow Cytometry Gating Strategies for Mouse HSPC
Several gating strategies can be employed to eliminate unwanted events prior to phenotyping HSPCs. Knowing the forward scatter (FSC) and side scatter (SSC) characteristics of your cells of interest can aid in proper gating. HSPCs are relatively uniform in size and lack intracellular complexity. As shown in Figures 1 - 3, the use of a tight FSC or SSC gate allows for the inclusion of small, non-granular cells that contain HSPCs while excluding dead cells, debris, and myeloid cells that are large and have lobular nuclei and/or a granular cytoplasm. FSC-area (FSC-A) and -height (FSC-H) parameters are also used to exclude cell doublets or triplets, which may be interpreted as cells co-expressing multiple markers. SSC signals can also be used to discriminate singlet events. Dead cells typically exhibit a greater autofluorescence than live cells and can non-specifically bind antibodies, thus appearing as false positives in the sample. Their exclusion improves the detection of live cells that express antigens of interest but at lower levels of fluorescence. After such pre-gating steps have been implemented, the frequency of LSK and LSK/SLAM HSCs can be determined by gating out Lin+ cells, followed by the analysis of cells expressing c-Kit, Sca1 (Figure 1), and SLAM markers (Figure 2). To identify ESLAM HSCs, follow the steps to pre-gate as above, and then set gates to identify CD45+EPCR+ cells followed by the analysis of the CD150+CD48- population (Figure 3).
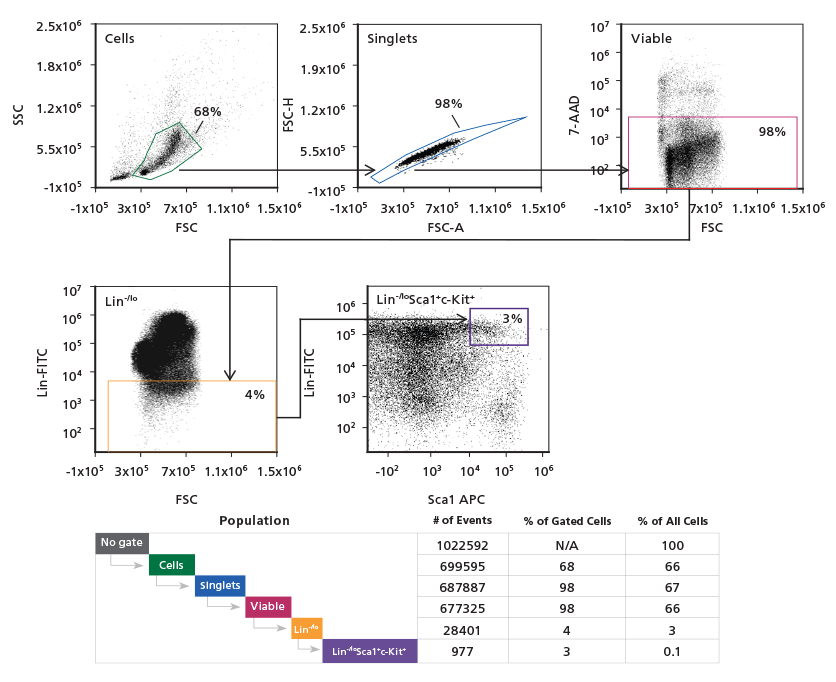
Figure 1. Gating Strategy to Phenotype Mouse LSK HSCs
Adult C57Bl/6 BM cells were stained with a
FITC lineage cocktail, PE c-Kit, and APC Sca1
antibodies. Primitive cells are initially refined
using a light scatter gate followed by the
exclusion of doublets and dead cells. The LSK
population is identified by first excluding Lin+
cells followed by gating on the Sca1+c-Kit+
population. Population subset analysis of the
number and percent of cells in gated regions
and within the entire population, is shown.
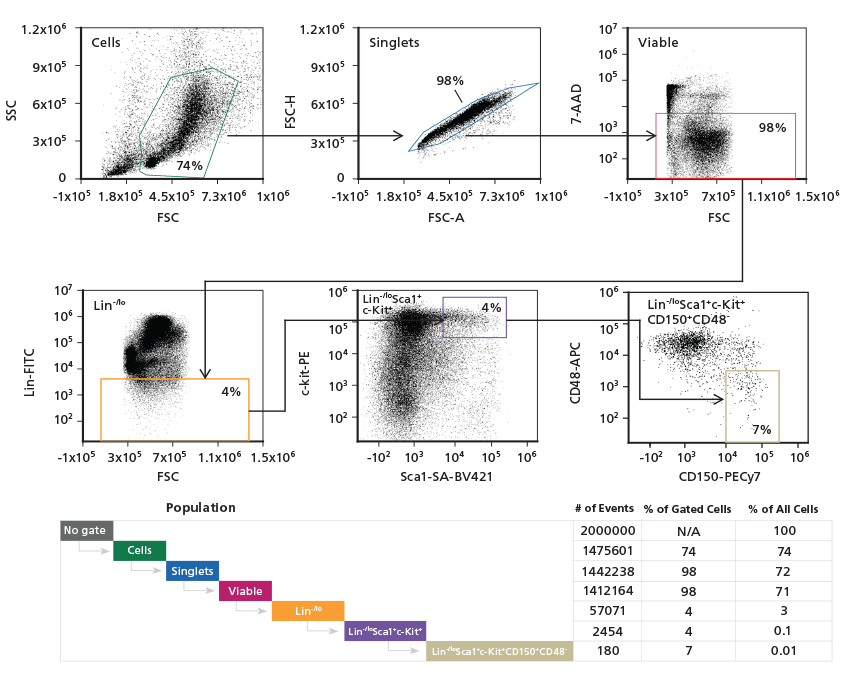
Figure 2. Gating Strategy to Phenotype Mouse LSK/SLAM HSCs
Adult mouse C57Bl/6 BM cells were stained
with a FITC lineage cocktail, PE c-Kit,
Biotin Sca1, APC CD48, and PECy7 CD150
antibodies. Binding of the Biotin Sca1 antibody
was revealed by secondary staining with
streptavidin conjugated to BV421 (SA-BV421).
The hematopoietic progenitor population was
initially refined using a light scatter gate followed
by discrimination of doublets and dead cells. Lin+
cells were excluded, followed by gating on the
Sca1+c-Kit+(LSK) population. CD150+CD48- cells
within the LSK population were identified and
quantitated in the final gating step. Population
subset analysis of the number and percent of
cells in gated regions and within the entire
population, is shown.
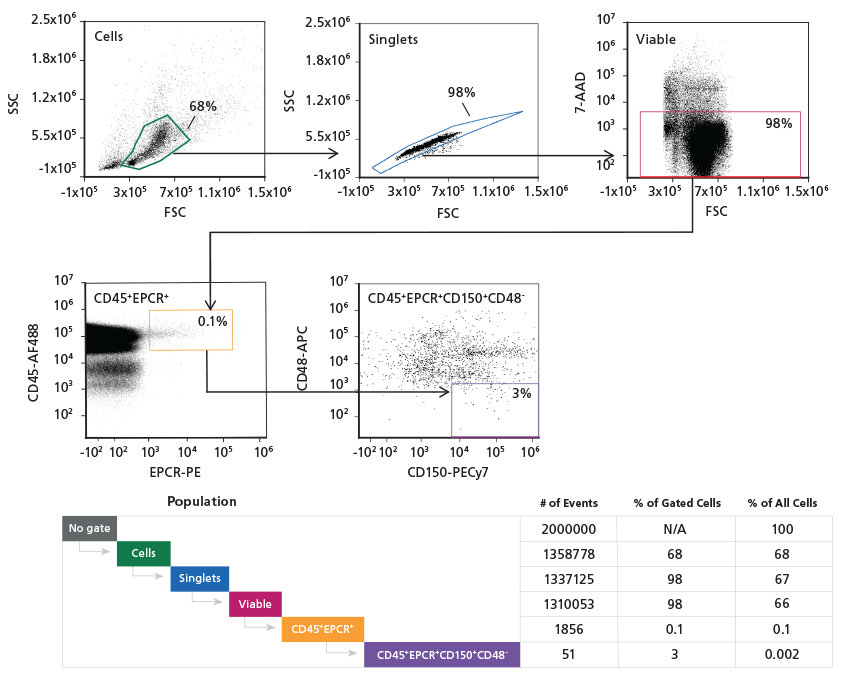
Figure 3. Gating Strategy to Phenotype Mouse ESLAM HSCs
Adult mouse C57Bl/6 BM cells were stained
with Alexa Fluor® 488 CD45, APC CD48,
PECy7 CD150, and PE EPCR antibodies. The
hematopoietic progenitor cell population was
initially refined using a light scatter gate followed
by discrimination of doublets and dead cells.
The population was then gated on CD45+EPCR+,
followed by gating on CD150+CD48- cells.
Population subset analysis of the number and
percent of cells in gated regions and within the
entire population, is shown.
Summary
Studies of hematopoiesis, and HSC biology in particular, are greatly facilitated by the use of highly purified populations of primitive cells whose phenotype has been very well defined by the work of many investigators over the past 30 years. The procedures described herein highlight the relative ease of interrogating the phenotype of mouse HSCs by flow cytometry using three independent antibody staining panels described in the literature. Additional pre-enrichment procedures, not described herein but employed before antibody staining and sorting, can be used to increase the frequency of HSPCs. This approach can reduce fluorescence-activated cell sorting (FACS) time and facilitate more reliable detection (and isolation) of rare subsets under certain experimental conditions. Lin-/lo cells can be pre-enriched using the EasySep™ Mouse Hematopoietic Progenitor Cell Isolation Kit (Catalog #19856) for this purpose. By combining the correct antigen-fluorochrome combinations with the preparation of proper controls, flow cytometry is a powerful tool for studying mouse hematopoiesis.
Recommended Products
| Product | Catalog # |
|---|---|
Anti-Mouse CD117 Antibody, Clone 2B8 | |
Anti-Mouse Sca-1 Antibody, Clone E13-161.7 | |
Anti-Mouse CD48 (SLAMF2) Antibody, Clone HM48-1 | |
Anti-Mouse CD150 Antibody, Clone TC15-12F12.2 | |
Anti-Mouse CD45 Antibody, Clone 30-F11 | |
Anti-Mouse EPCR Antibody, Clone RMEPCR1560 (1560) |
Related Resources


References
- Yamamoto R et al. (2013) Cell 154(5): 1112–26.
- Paul F et al. (2015) Cell 163(7): 1663–77.
- Notta F et al. (2016) Science 351(6269): aab2116.
- Quesenberry PJ et al. (2015) Stem Cells 33(1): 15–20.
- Randall TD & Weissman IL. (1998) Blood 89(10): 3596–606.
- Dooner GJ et al. (2008) J Cell Physiol 214(3): 786–95.
- Kim I et al. (2006) Blood 108(2): 737–44.
- Kiel MJ et al. (2005) Cell 121(7): 1109–21.
- Yilmaz OH et al. (2006) Blood 107(3): 924–30.
- Kent DG et al. (2009) Blood 113(25): 6342–50.
- Benz C et al. (2012) Cell Stem Cell 10(3): 273–83.
- Kent DG et al. (2016) Curr Protoc Stem Cell Biol 38: 2A.4.1–2A.4.24.
- Rundberg Nilsson A et al. (2013) Cytometry A. 83(8): 721–7.
- Maecker HT & Trotter J. (2006) Cytometry A 69(9): 1037–42.
- Baumgarth N & Roederer M. (2000) J Immunol Met 243(1-2): 77–97.
- Haylock DN et al. (2007) Stem Cells 25(4): 1062–9.
Request Pricing
Thank you for your interest in this product. Please provide us with your contact information and your local representative will contact you with a customized quote. Where appropriate, they can also assist you with a(n):
Estimated delivery time for your area
Product sample or exclusive offer
In-lab demonstration


