Identification of ALDH-Expressing Cancer Stem Cells Using ALDEFLUOR™
.
- Document # 29937
- Version 1.0.0
- Aug 2009
Introduction
The study of cancer stem cells (CSC) began over four decades ago with the discovery of leukemic stem cells.1 Currently there are two CSC models that exist in the field.1 One model predicts that CSCs arise from random mutations and subsequent clonal selections.1 The other model hypothesizes that cancer originates in tissue stem or progenitor cells through dysregulation of self-renewal pathways1 leading to an expansion of the CSC population. Many methods have been developed to help identify, isolate and evaluate the mechanisms behind CSC functionalities. One widely accepted method for identifying cancer stem cells is based on the enzymatic activity of aldehyde dehydrogenase 1 (ALDH1),2-7 a detoxifying enzyme responsible for the oxidation of intracellular aldehydes.1 There are different isoforms of ALDH. The ALDEFLUOR® assay system has been developed to detect the activity of the ALDH1 isoform.
The ALDEFLUOR® assay system was originally developed for identifying ALDH-expressing hematopoietic stem cells. Since then, ALDH has been used to isolate putative stem cells from various tissues. A recent study by Ginestier et al. showed that ALDH-positive cells isolated from human breast tumors contain CSCs and were capable of generating tumors in NOD/SCID mice.2 In addition, ALDH-positive CSCs from the colon,3 brain,6 and liver8 were also capable of forming tumors in immuno-compromised NOD/SCID mice, whereas ALDH-negative cells did not. The protocol required for optimal ALDH staining of tumor cells may be different from the standard ALDEFLUOR® protocol that was developed for hematopoietic cells. This technical bulletin outlines an optimized protocol for using the ALDEFLUOR® assay to detect ALDH activity in human breast cancer cell lines.
References:
- Charafe-Jauffret E, et al. Pathobiology. 75: 75 – 84, 2008
- Ginestier C, et al. Cell Stem Cell. 1: 555 – 567, 2007
- Huang EH, et al. Cancer Res. 69: 3382 – 3389, 2009
- Dalerba P, et al. PNAS. 104: 10158 – 10163, 2007
- Ma S, et al. Mol Cancer Res. 6: 1146 – 1153, 2008
- Corti S, et al. Stem Cells. 24: 975 – 985, 2006
- Jiang F,et al. Mol Cancer Res. 7: 330 – 338, 2009
- Ma S, et al. Mol Cancer Res. 6: 1146 – 1153, 2008
ALDH Expression in MCF7 and SKBR3 Human Breast Cancer Cell Lines
The expression of ALDH varies between different types of cell lines. MCF7 and SKBR3 are examples of established human breast cancer cell lines commonly used in breast cancer research. SKBR3 cells express high levels of ALDH and can be used as a positive control. MCF7 cells express little to no ALDH and can be used as a negative control. Optimal time for staining SKBR3 cells with ALDEFLUOR® to detect ALDH activity is between 30 – 45 minutes in a 37°C water bath (Figure 1). Interestingly, incubating for 60 minutes diminishes the ALDH staining (Figure 1) in SKBR3 cells.
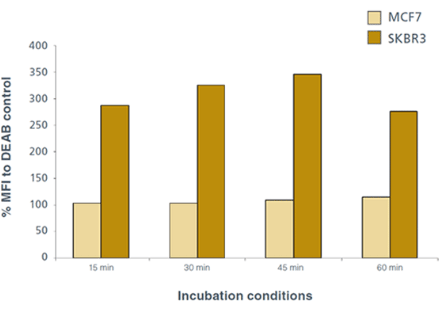
Figure 1: Effect of different incubation conditions with ALDEFLUOR® on mean fluorescence intensity as determined by flow cytometry. Optimal time for staining MCF7 and SKBR3 cells is between 30 – 45 minutes in a 37°C water bath. Incubating cells with ALDEFLUOR® for 60 minutes diminishes fluorescence. Mean fluorescence intensity (MFI) is calculated as a percentage of DEAB control.
Background staining of MCF7 cells showed very little change with different incubation times (Figure 1 and Figure 2A). ALDEFLUOR® staining can be visualized by fluorescent microscopy to further demonstrate that SKBR3 cells express ALDH (Figure 3).
Flow Cytometry Results
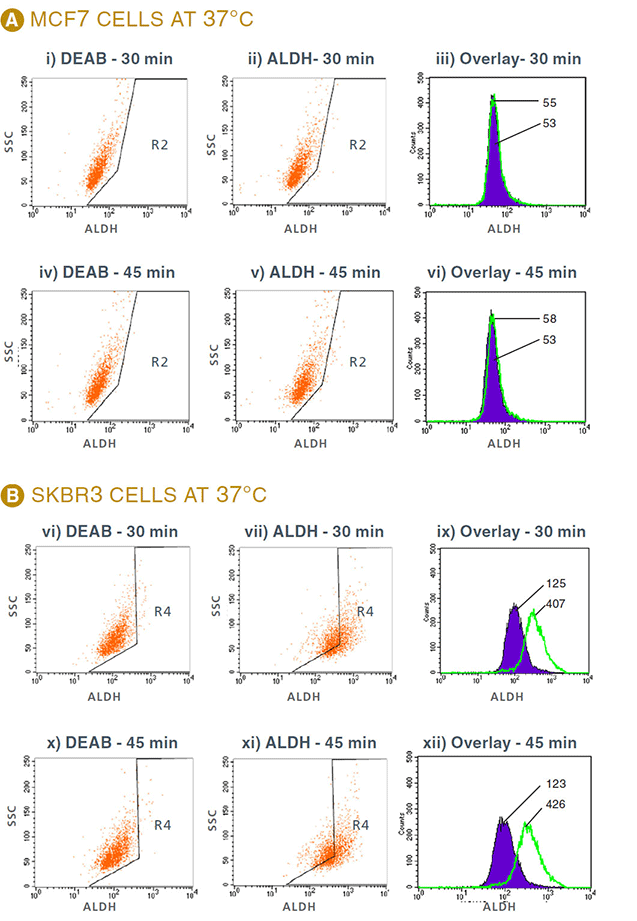
Figure 2: Flow cytometry results of MCF7 and SKBR3 cells stained with ALDEFLUOR®. Gates (R2, R4) were set according to DEAB control. A. ALDH profiles of MCF7 cells, and B. SKBR3 cells incubated with ALDEFLUOR® for 30 and 45 minutes. FACS profiles of DEAB control (i,iv,vi,x) and ALDH (ii,v,vii,xi) and overlay (iii,vi,ix,xii) of DEAB (purple histograms) and ALDH staining (green histograms). Numbers indicate the MFI of each peak. MFI: Mean Fluorescence Intensity. DEAB: ALDH inhibitor, SSC: Side Scatter.
Protocol: Detecting ALDH expression in MCF7 and SKBR3 cell lines using ALDEFLUOR®
- Pre-warm cell culture medium, Trypsin-EDTA (Catalog #07901), D-PBS (Catalog #37350) and all reagents in the ALDEFLUOR® Kit (Catalog #01700) to room temperature (15°C – 25°C). Keep a 1 mL aliquot of ALDEFLUOR® assay buffer on ice for step 15.
- Cell culture medium for the MCF7 cell line contains MEM medium (Catalog #36550), 0.01 mg/mL insulin and 10% FBS (Catalog #06100).
- Cell culture medium for the SKBR3 cell line contains McCoy’s 5A medium (Catalog #36350), 2 mM L-glutamine (Catalog #07100) and 10% FBS (Catalog #06100).
- Remove the dishes of cells to be assayed to a biological safety cabinet.
Note: It is recommended that all procedures be carried out aseptically, though sterility is not essential if the culture is not to be passaged. - Aspirate the cell culture medium from the 10 cm dish and rinse once by dispensing 5 – 10 mL of room temperature D-PBS (Catalog #37350). Gently swirl the dish once, aspirate and discard the PBS rinse solution.
Note: Rinsing the monolayer dilutes traces of serum that may interfere with the activity of Trypsin-EDTA. Dispense 1 mL of Trypsin-EDTA into the dish. Gently rock the dish back and forth to ensure the monolayer of cells is coated with Trypsin-EDTA. - Dispense 1 mL of Trypsin-EDTA into the dish. Gently rock the dish back and forth to ensure the monolayer of cells is coated with Trypsin-EDTA.
- Incubate the dish in a humidified, 37°C, 5% CO2 incubator for 1 minute or until the cells have rounded up when observed under a light microscope.
- Add 9 mL of the appropriate cell culture medium (described in Step 1) to the dish. Gently detach the cells by pipetting the medium up and down to resuspend the cells into a single cell suspension.
- Transfer the cell suspension into a 15 mL conical tube and centrifuge at 300 x g for 7 minutes to pellet the cells. Carefully aspirate and discard the supernatant making sure to not disturb the cell pellet. Resuspend the cell pellet with 10 mL of D-PBS to remove residual Trypsin-EDTA.
- Centrifuge the cell suspension at 300 x g for 7 minutes to pellet the cells. Aspirate and discard the PBS rinse solution. Resuspend the cells in 1 mL of room temperature (15°C – 25°C) ALDEFLUOR® assay buffer.
- Determine the viable cell concentration by performing Trypan Blue (Catalog #07050) exclusion cell count and adjust the final cell concentration to 1 x 10⁵ – 1 x 10⁶ cells/mL with room temperature (15°C – 25°C)
Note: Do not exceed 1 x 10⁶ cells/mL. The concentration of cells may need to be titrated for samples that express high ALDH levels. - Label one 12 x 75 mm Falcon tube (BD Catalog #352058) 'test' and one 12 x 75 mm Falcon tube 'control'. Place 1 mL of the adjusted cell suspension into the 'test' sample tube. For each additional sample, label a pair of tubes 'test' and 'control'.
- Add 5 μL of a 1.5 mM DEAB stock solution to the 'control' tube. Recap the control tube and DEAB vial immediately
Note: DEAB is provided in 95% ethanol. Recap immediately to prevent evaporation. - Add 5 μL of activated ALDEFLUOR® substrate per mL of sample to the “test” tube.
Note: To activate the ALDEFLUOR® substrate, refer to the product information sheet provided with the ALDEFLUOR® Kit. - Mix and immediately transfer 0.5 mL of the ALDEFLUOR® substrate and cell mixture to the DEAB “control” tube. The final DEAB concentration should be 15 μM.
Note: The ALDH enzymatic reaction begins immediately upon addition of the activated substrate to the cell suspension. It is imperative that an aliquot of the ALDEFLUOR®-reacted cells is added to the DEAB control tube immediately - Incubate the 'test' and 'control' samples between 30 – 45 minutes in a 37°C water bath. (Do not exceed 60 minutes as this will diminish the ALDEFLUOR® fluorescence. See optimized results on page 1 of this technical bulletin.)
Note: If immunophenotyping is performed in addition to the ALDEFLUOR® assay, add and incubate the antibodies after step 15. For a protocol on immunophenotyping, please refer to the product information sheet provided with the ALDEFLUOR® Kit. - Following incubation, centrifuge the 'test' and 'control' tubes at 4°C for 5 minutes at 300 x g. Carefully aspirate the supernatant without disturbing the cell pellet. Resuspend the cell pellet in 0.5 mL of ice cold ALDEFLUOR® assay buffer and place samples immediately on ice. These samples are ready for flow cytometry analysis.
Note: It is essential that samples be kept on ice once the ALDEFLUOR® substrate incubation is completed to prevent efflux of the fluorescent products. For best results, samples should be analyzed by flow cytometer shortly after the staining procedure. - Optional: To exclude dead cells from data acquisition, add 1 μg/mL of propidium iodide to each tube prior to flow cytometry.
- Perform data acquisition of each sample. Acquire at least 100,000 events per sample. For details on flow cytometer set-up and data acquisition, refer to the product information sheet provided with the ALDEFLUOR® Assay Kit.
Important: This protocol has been optimized and validated for the MCF7 and SKBR3 breast cancer cell lines. Some optimization of the cell concentration, the DEAB and ALDEFLUOR® substrate concentration and incubation times may be required when using other types of cell lines.
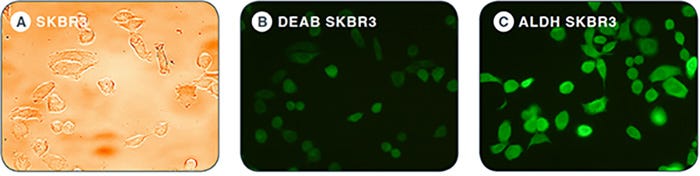
Figure 3: Brightfield and fluorescent images of MCF7 and SKBR3 cells stained with ALDEFLUOR®. A. Brighfield images of SKBR3 monolayers. B. DEAB control of SKBR3 cells show dim fluorescence. C. SKBR3 is brightly stained with ALDEFLUOR® due to high expression of ALDH as indicated by flow cytometry results in Figure 2B, ix and xii. DEAB and ALDH images are obtained with the same fluorescence intensity.
Publications Citing the Use of the ALDEFLUOR® Assay System with Different Tissue Types:
Mammary Stem Cells:
- Charafe-Jauffret E, et al. Breast cancer cell lines contain functional cancer stem cells with metastatic capacity and a distinct molecular signature. Cancer Res. 69: 1302 – 1313, 2009 [Human]
- Ginestier C,et al. ALDH1 is a marker of normal and malignant human mammary stem cells and a predictor of poor clinical outcome. Cell Stem Cell. 1: 555 – 567, 2007 [Human]
- Graham JD, et al. DNA replication licensing and progenitor numbers are increased by progesterone in normal human breast. 150: 3318 – 3326, 2009 [Human]
- Ibarra I, et al. A role for microRNAs in maintenance of mouse mammary epithelial progenitor cells. Genes Dev. 21: 3238 – 3243, 2007 [Mouse]
- Luo M, et al. Mammary epithelial-specific ablation of the focal adhesion kinase suppresses mammary tumorigenesis by affecting mammary cancer stem/progenitor cells. Caner Res. 69: 466 – 474, 2009 [Mouse]
- Magnifico A, et al. Tumor-initiating cells of HER2-positive carcinoma cell lines express the highest oncoprotein levels and are sensitive to trastuzumab. Clin Can. Res. 15: 2010 – 2021, 2009 [Human]
Pancreatic Stem Cells:
- Feldmann G, et al. Blockade of hedgehog signaling inhibits pancreatic cancer invasion and metastases: a new paradigm for combination therapy in solid cancers. Cancer Res. 67: 2187 – 2196, 2007 [Human]
- Feldmann G, et al. An orally bioavailable small-molecule inhibitor of Hedgehog signaling inhibits tumor initiation and metastasis in pancreatic cancer. Mol Cancer Ther. 7: 2725 – 2735, 2008 [Human]
- Kallifatidis G, et al. Sulforaphane targets pancreatic tumor-initiating cells by NF-kappaB induced antiapoptotic signaling. Gut. 58: 949 – 963, 2009 [Human]
- Mullendore ME, et al. Ligand-dependent Notch signaling is involved in tumor initiation and tumor maintenance in pancreatic cancer. Clin Cancer Res. 15: 2291 – 2301, 2009 [Human]
Colon/Colorectal Stem Cells:
- Dalerba P, et al. Phenotypic characterization of human colorectal cancer stem cells. PNAS. 104: 10158 – 10163, 2007 [Human]
- Huang EH, et al. Aldehyde dehydrogenase 1 is a marker for normal and malignant human colonic stem cells (SC) and tracks SC overpopulation during colon tumorigenesis. Cancer Res. 69: 3382 – 3389, 2009 [Human]
Neural Stem Cells:
- Bar EE, et al. Cyclopamine-mediated hedgehog pathway inhibition depletes stem-like cancer cells in glioblastoma. Stem Cells. 25: 2524 – 2533, 2007 [Human]
- Corti S, et al. Identification of a primitive brain-derived neural stem cell population based on aldehyde dehydrogenase activity. Stem Cells. 24: 975 – 985, 2006 [Mouse]
Lung Stem Cells:
- Jiang F, et al. Aldehyde dehydrogenase 1 is a tumor stem cell-associated marker in lung cancer. Mol Cancer Res. 7: 330 – 338, 2009 [Human]
- Jiang T, et al. Achaete-scute complex homologue1 regulates tumor-initiating capacity in human small cell lung cancer. Cancer Res. 69: 845 – 854, 2009 [Human]
- Moreb JS, et al. Heterogeneity of aldehyde dehydrogenase expression in lung cancer cell lines is revealed by ALDEFLUOR flow-cytometry based assay. Cytometry B Clin Cytom. 72: 281 – 289, 2007 [Human]
Liver Stem Cells:
- Ma S, et al. Aldehyde dehydrogenase discriminates the CD133 liver cancer stem cell populations. Mol Cancer Res. 6: 1146 – 1153, 2008 [Human]
Product Information
Request Pricing
Thank you for your interest in this product. Please provide us with your contact information and your local representative will contact you with a customized quote. Where appropriate, they can also assist you with a(n):
Estimated delivery time for your area
Product sample or exclusive offer
In-lab demonstration

