Setting Up Controls and Gating for ALDHbr Assay Analysis
Find everything you need to know about preparing the proper single color controls, FMOs and gates for performing flow cytometry analysis of the ALDHbr assay
The ALDHbr assay is a flow cytometry-based assay that measures the frequency of human cord blood cells that are viable, exhibit high levels of aldehyde dehydrogenase (ALDH) activity (and are termed ALDH “bright” or ALDHbr), and stain positively for the cell surface markers CD45 and CD34. To be useful as a potency assay, the ALDHbr assay depends on the reproducibility of its staining, data acquisition and analysis methods.
The preparation of appropriate negative, single color and ‘fluorescence-minus-one’ (FMO) controls is necessary for accurate compensation of fluorescent signals and for setting appropriate gates to calculate the percentage of ALDHbrCD34+ cells within the viable CD45+ cell population.
Preparation of Samples and Controls
The preparation of cells for analysis in the ALDHbr assay consists of 2 stages. The first stage is an enzymatic reaction to measure the activity of ALDH in each cell. Test cells are incubated with activated ALDEFLUOR™ Reagent, BODIPY™ Aminoacetealdehyde (BAAA), which is converted by the enzymatic activity of ALDH into negatively charged BODIPY™ Aminoacetate (BAA) that is retained inside cells. As a negative control, a second cell sample is incubated with BAAA in the presence of the ALDH-inhibitor diethylaminobenzaldehyde (DEAB).
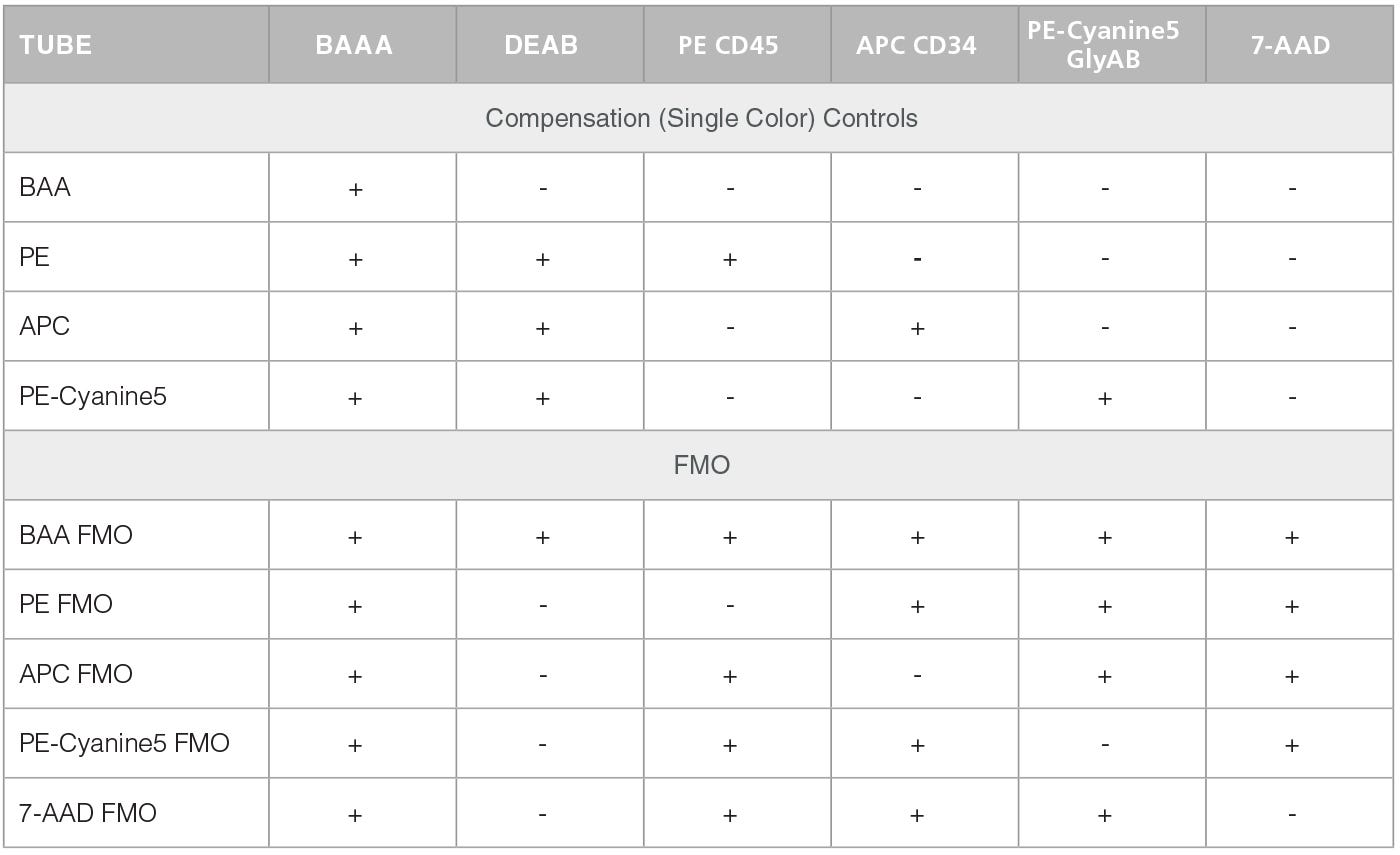
In the second stage, test and control cell samples are stained with fluorescently-labeled antibodies against CD45, CD34 and Glycophorin A/B (GlyAB). At this stage compensation and FMO control tubes are also prepared. Table 1 below presents a scheme for the staining of test sample and negative control (containing DEAB). This staining (including the preparation of a negative control) is repeated for every test sample. Table 2 shows a scheme for the staining of the compensation and FMO controls. Compensation and FMO control staining and analysis should be performed on at least one sample per experiment. For additional details on the preparation of samples and reagents please go to the product information sheet on the ALDHbr Assay Kit product page.
Table 1. Staining of Test Sample and Negative Control
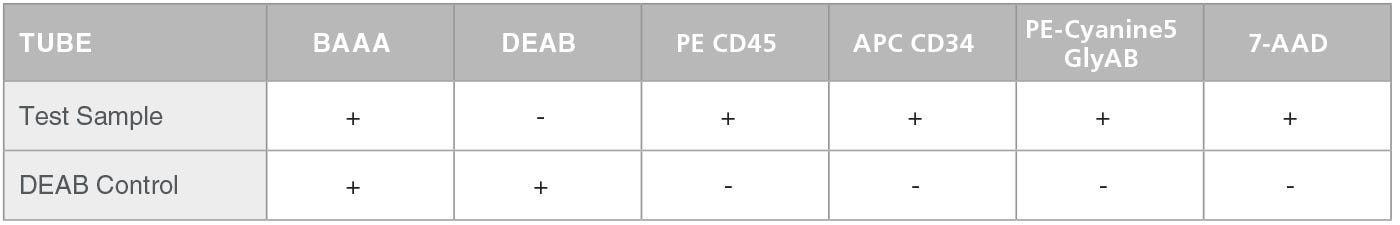
Table 2. Staining of Compensation Controls and FMOs
Gating and Data Analysis
Create a Side Scatter (SSC) vs Forward Scatter (FSC) density plot. Using the DEAB control; adjust FSC and SSC voltages and gains to center the nucleated cell population within the SSC vs FSC density plot.
NOTE: Avoid using a threshold for SSC as the cell population of interest is SSClo. Draw a generous region on the density plot to encompass the nucleated cell population.
- Create the following two-dimensional density plots for compensation
- SSC vs 7-AAD/PE-Cyanine5 GlyAB
- SSC vs PE CD45
- SSC vs BAA
- SSC vs APC CD34
- Single color controls are used to set compensation for spillover between the different fluorescence channels. Compensation can be set before or after data acquisition depending on the type of flow cytometer and software used.
- After compensation adjustments have been made, create the following two-dimensional density plots for each sample tested:
- SSC vs FSC
- SSC vs 7-AAD/PE-Cyanine5 GlyAB
- SSC vs PE CD45
- SSC vs BAA
- APC CD34 vs PE CD45
- Five gates are then drawn sequentially to identify viable, nucleated (7-AAD-GlyAB-) cells, CD45+ cells, ALDHbr cells with low SSC and CD34+ cells within the 7-AAD-GlyAB-CD34+CD45+ALDHbr cell subset. Gating boundaries should be determined using the FMO gating controls. Shown in Figure 1 is the general gating strategy for identifying the percentage of this cell subset.
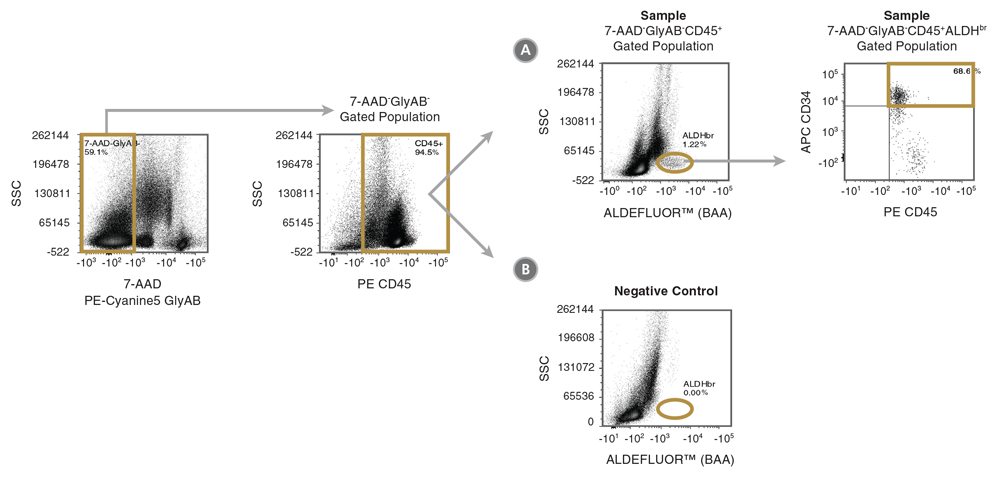
Figure 1. Gating Strategy to Identify 7-AAD-GlyAB-CD34+CD45+ALDHbr Cells
Shown is the suggested gating strategy to quantitate the % of 7-AAD-GlyAB-CD34+CD45+ALDHbr cells in a cord blood sample. Dot plots from the analysis of the (A) fully stained sample are shown, along with a control plot generated from (B) the BAA FMO tube. In this example, the data for the (A) test and (B) control sample are first gated on 7-AAD-GlyAB- (measured in the same fluorescence channel) and CD45+ cells to exclude dead cells, GlyAB+ red blood cells (RBCs) and CD45- non-hematopoietic cells, respectively. The DEAB control can also be used as negative control, but as it is not stained with antibodies for GlyAB or CD45 or with 7-AAD, the SSC vs ALDEFLUOR™ (BAA) plot (as shown in B) for the DEAB control sample is generated using data gated only on SSC and FSC.
Note: Removal of red blood cells from the CB sample prior to staining is highly encouraged as it increases the accuracy of assay analysis when drawing gates, allows for faster data collection and results in smaller file sizes to be generated.
For more information about our ALDHbr Assay Kit or performing and analyzing this assay, explore our technical bulletin: “ALDHbr Assay Kit for Enumeration of HSPCs in Cord Blood by Flow Cytometry” or contact techsupport@stemcell.com.
This tech tip is published as part of our Hematopoiesis Hub. Visit to find more tips about classic and new products, see conversations with experts in the field about their science, request a wallchart and more!
Request Pricing
Thank you for your interest in this product. Please provide us with your contact information and your local representative will contact you with a customized quote. Where appropriate, they can also assist you with a(n):
Estimated delivery time for your area
Product sample or exclusive offer
In-lab demonstration


