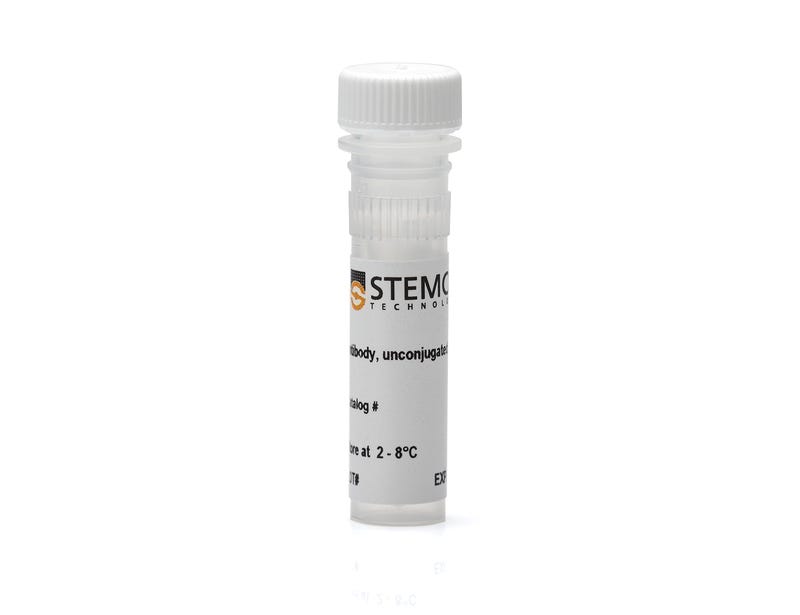
Anti-Human CD71 (Transferrin Receptor) Antibody, Clone OKT9
Mouse monoclonal IgG1 antibody against human CD71 (transferrin receptor)
Request Pricing
Thank you for your interest in this product. Please provide us with your contact information and your local representative will contact you with a customized quote. Where appropriate, they can also assist you with a(n):
Estimated delivery time for your area
Product sample or exclusive offer
In-lab demonstration
Overview
Data Figures
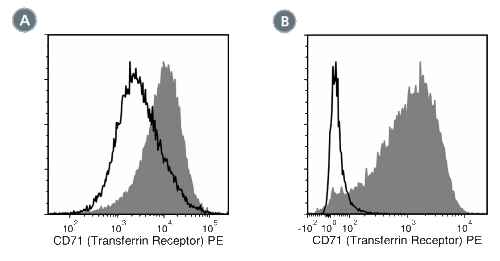
Figure 1. Data for Unconjugated
(A) Flow cytometry analysis of CD3+ cells (T cells) isolated from human peripheral blood mononuclear cells (PBMCs), then stimulated by incubation with anti-CD3 and anti-CD28 antibodies. Cells were labeled with Anti-Human CD71 (Transferrin Receptor) Antibody, Clone OKT9, followed by a rat anti-mouse IgG1 antibody, PE (filled histogram), or a mouse IgG1, kappa isotype control antibody followed by a rat anti-mouse IgG1 antibody, PE (solid line histogram).
(B) Flow cytometry analysis of CD3+ cells isolated from human PBMCs, then stimulated by incubation with anti-CD3 and anti-CD28 antibodies. Cells were labeled with Anti-Human CD71 (Transferrin Receptor) Antibody, Clone OKT9, which had been pre-incubated for 5 min with a rat anti-mouse IgG1 antibody, PE (filled histogram), or a mouse IgG1, kappa isotype control antibody, which had been pre-incubated for 5 min with a rat anti-mouse IgG1 antibody, PE (solid line histogram). Pre-incubating the primary and secondary antibodies helped minimize background binding of the secondary antibody to the anti-CD3 and anti-CD28 antibodies used for stimulating the cells.
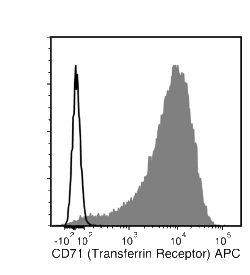
Figure 2. Data for APC-Conjugated
Flow cytometry analysis of CD3+ cells (T cells) isolated from human peripheral blood mononuclear cells (PBMCs), then stimulated by incubation with anti-CD3 and anti-CD28 antibodies. Cells were labeled with Anti-Human CD71 (Transferrin Receptor) Antibody, Clone OKT9, APC (filled histogram) or a mouse IgG1, kappa isotype control antibody, APC (solid line histogram).
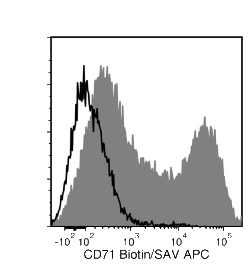
Figure 3. Data for Biotin-Conjugated
Flow cytometry analysis of CD3+ cells (T cells) isolated from human peripheral blood mononuclear cells (PBMCs), then stimulated by incubation with anti-CD3 and anti-CD28 antibodies. Cells were labeled with Anti-Human CD71 (Transferrin Receptor) Antibody, Clone OKT9, Biotin followed by streptavidin (SAV) APC (filled histogram), or a biotinylated mouse IgG1, kappa isotype control antibody followed by SAV APC (solid line histogram).
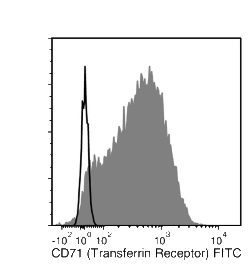
Figure 4. Data for FITC-Conjugated
Flow cytometry analysis of CD3+ cells (T cells) isolated from human peripheral blood mononuclear cells (PBMCs), then stimulated by incubation with anti-CD3 and anti-CD28 antibodies. Cells were labeled with Anti-Human CD71 (Transferrin Receptor) Antibody, Clone OKT9, FITC (filled histogram) or a mouse IgG1, kappa isotype control antibody, FITC (solid line histogram).
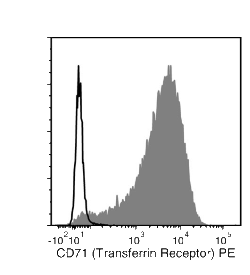
Figure 5. Data for PE-Conjugated
Flow cytometry analysis of CD3+ cells (T cells) isolated from human peripheral blood mononuclear cells (PBMCs), then stimulated by incubation with anti-CD3 and anti-CD28 antibodies. Cells were labeled with Anti-Human CD71 (Transferrin Receptor) Antibody, Clone OKT9, PE (filled histogram) or a mouse IgG1, kappa isotype control antibody, PE (solid line histogram).
Protocols and Documentation
Find supporting information and directions for use in the Product Information Sheet or explore additional protocols below.
Applications
This product is designed for use in the following research area(s) as part of the highlighted workflow stage(s). Explore these workflows to learn more about the other products we offer to support each research area.
Resources and Publications
Educational Materials (2)
Related Products
-
 StemSpan™ Erythroid Expansion Supplement (1...
Serum-free culture supplement for expansion of human erythroid cells
-
 StemSpan™ SFEM II
Serum-free medium for culture and expansion of hematopoietic cells
-
 Mouse IgG1, kappa Isotype Control Antibody, C...
Mouse monoclonal IgG1, kappa isotype control antibody
-
 Mouse IgG1, kappa Isotype Control Antibody, C...
Mouse monoclonal IgG1, kappa isotype control antibody
Item added to your cart

Anti-Human CD71 (Transferrin Receptor) Antibody, Clone OKT9
Legal Statement:
Alexa Fluor is a registered trademark of Life Technologies Corporation. Antibodies conjugated to Alexa Fluor® are licensed for internal research use only and sale is expressly conditioned on the buyer not using the antibody for manufacturing, performing a service or medical test, or otherwise generating revenue. For use other than research, contact Life Technologies Corporation, 5791 Van Allen Way, Carlsbad, CA 92008 USA or outlicensing@lifetech.com.
Quality Statement:
PRODUCTS ARE FOR RESEARCH USE ONLY AND NOT INTENDED FOR HUMAN OR ANIMAL DIAGNOSTIC OR THERAPEUTIC USES UNLESS OTHERWISE STATED. FOR ADDITIONAL INFORMATION ON QUALITY AT STEMCELL, REFER TO WWW.STEMCELL.COM/COMPLIANCE.
